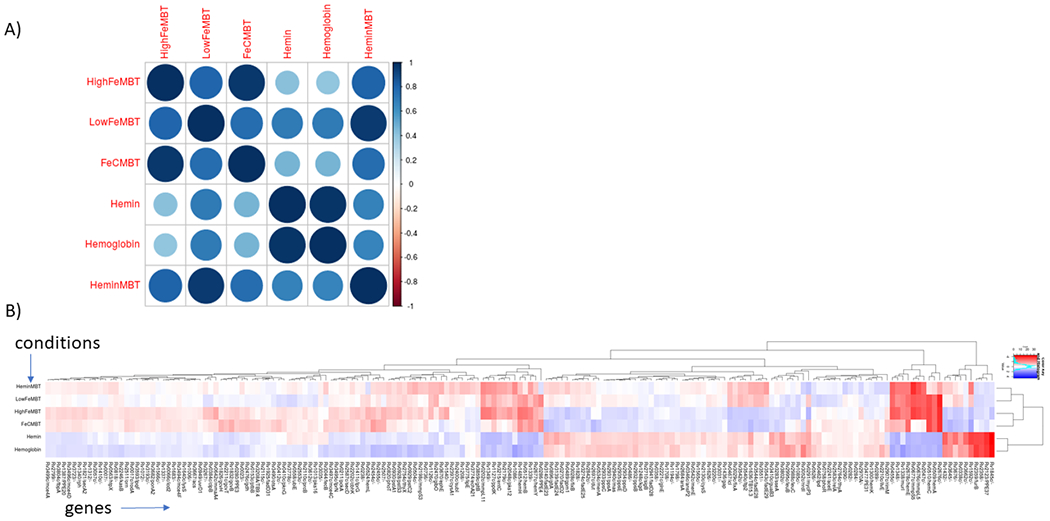
Figure 1:

a) Correlation plot among iron-supplementation conditions based on significantly varying genes according to ANOVA. b) Heatmap of same data showing clustering of genes and conditions. Blue means more insertions than average (i.e. less essential), and red means less insertions than average (i.e. more essential).
