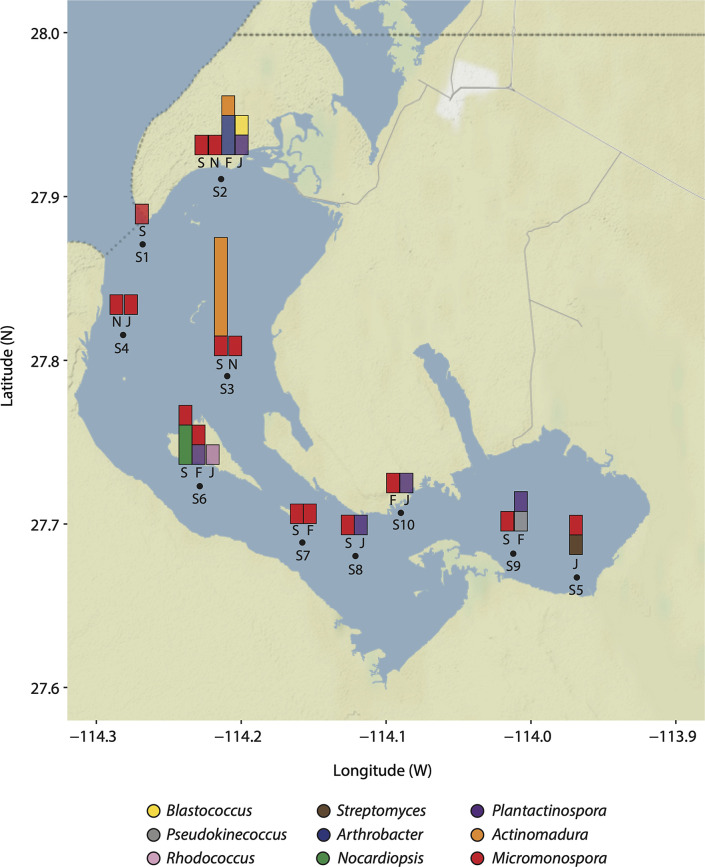
Fig. 1.
The Ojo de Liebre Lagoon. Sampling stations are shown in the map as numbered black dots (S1-S10) distributed along the Lagoon. Bar charts on top of sampling stations depict the seasonal distribution (September 2017 = S, November 2017 = N, February 2018 = F and June 2018 = J) and abundance of isolated actinobacteria genera. Bars for sampling seasons in which no actinobacteria were isolated are not shown. Bars are coloured according to key.

