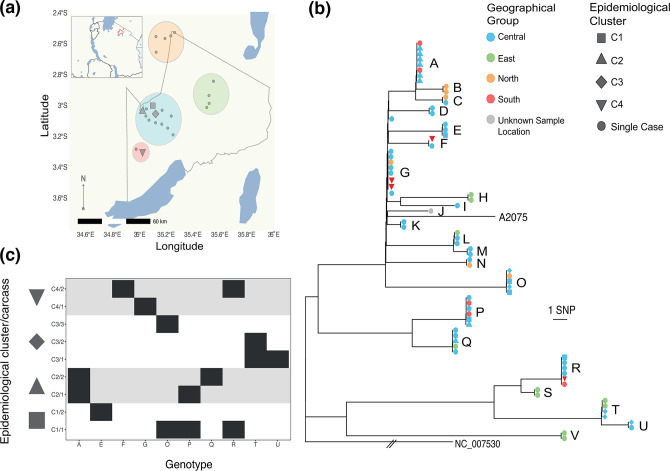
Fig. 3.
Phylogeography of B. anthracis in the hyperendemic area of the NCA, Tanzania. (a) Spatial distribution of carcasses from which B. anthracis isolates were obtained. The map outlines the NCA and shows its location in northern Tanzania (outlined in red in inset). Carcasses were assigned to four geographical groups within the NCA based on spatial proximity, shown by coloured circles. (b) Maximum-likelihood tree estimating the phylogenetic relationship among B. anthracis isolates from the NCA. This tree is based on an un-gapped alignment of 125 high-quality core SNPs across the whole chromosome, rooted to the Ames Ancestor reference sequence (accession no. NC_005730) and including the publicly available isolate A2075 (accession no. SRR2968187) originating from central Tanzania. Using the more closely related isolates from cluster 3.2 as an outgroup produced the same root position. Isolates are coloured on the tree based on their collection site (geographical group) within the NCA. Epidemiological clusters of cases (pairs of carcasses sampled from the same or neighbouring households on the same or consecutive days) are distinguished by symbol shape. Letters distinguish the 22 unique genotypes (SNP profiles) detected. (c) Genotypes of B. anthracis isolated from within and between pairs of carcasses from the same epidemiological clusters (C1–C4). Individual carcasses are numbered /1 or /2. In cluster C3, two isolates were from a soil sample (C3/1) collected at the same household as the two cases (C3/2 and C3/3); genotype T from this soil sample was shared with an isolate from C3/2. Otherwise, only in C2 was there evidence of a shared genotype between pairs of carcasses (genotype A). Thus, the level of sampling conducted here (1–4 isolates per carcass) did not produce evidence for the same combinations of genotypes being found among linked carcasses. Isolate-labelled versions of (a) and (b) can be found as Figs S7 and S8. The base earth, river and lake data for the map were downloaded from Natural Earth (https://www.naturalearthdata.com/). This figure was plotted in R v.3.6.1 with ggplot2 [61], with the addition of the sf [62] and ggtree [63] packages.

