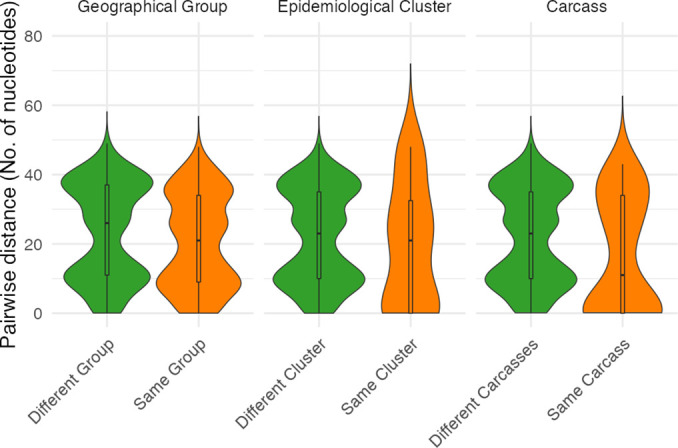
Fig. 4.

Comparative numbers of single nucleotide differences among B. anthracis isolates from hierarchical spatial scales. Violin plots comparing pairwise nucleotide (SNP) differences between all B. anthracis isolates from the NCA versus SNP differences between isolates from: (i) within the same geographical group; (ii) within the same epidemiological cluster (but not from the same carcass); and (iii) within a single carcass. The plot width at each point along the y-axis reflects the number of observations of different pairwise distances. The central boxplot shows median and IQR, with whiskers showing minimum and maximum values up to 1.5 times the IQR.
