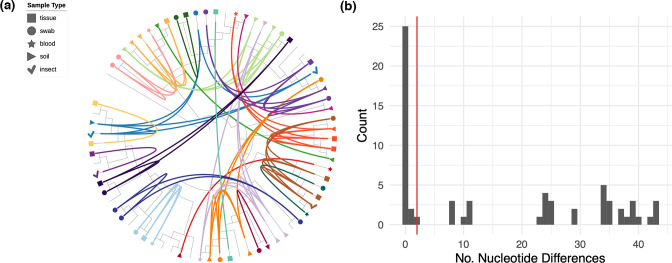
Fig. 5.
Within-host diversity of B. anthracis among livestock in the NCA. (a) Circularized maximum-likelihood tree – based on high-quality core SNPs – displayed as a cladogram (branch-lengths ignored), rooted to the Ames Ancestor reference genome (accession no. NC_005730). Isolates from the same carcass are shown in the same colour and are linked by inner connecting lines. Isolates without labels are singletons (i.e. only one isolate sequenced per carcass site). Sample type is shown by the different symbol shapes indicated in the legend. The figure was prepared using iTOL [64]. For labelled taxa, see Fig. S9. (b) Histogram showing the relative frequency of pairwise SNP differences among B. anthracis isolates collected from the same carcass. The red line shows 99 % upper limit of nucleotide differences observed among sampled pairs of genomes based on simulation of within-host evolution. Results suggest that almost all diversity observed within the same infected host is the result of a heterogenous inoculum.

