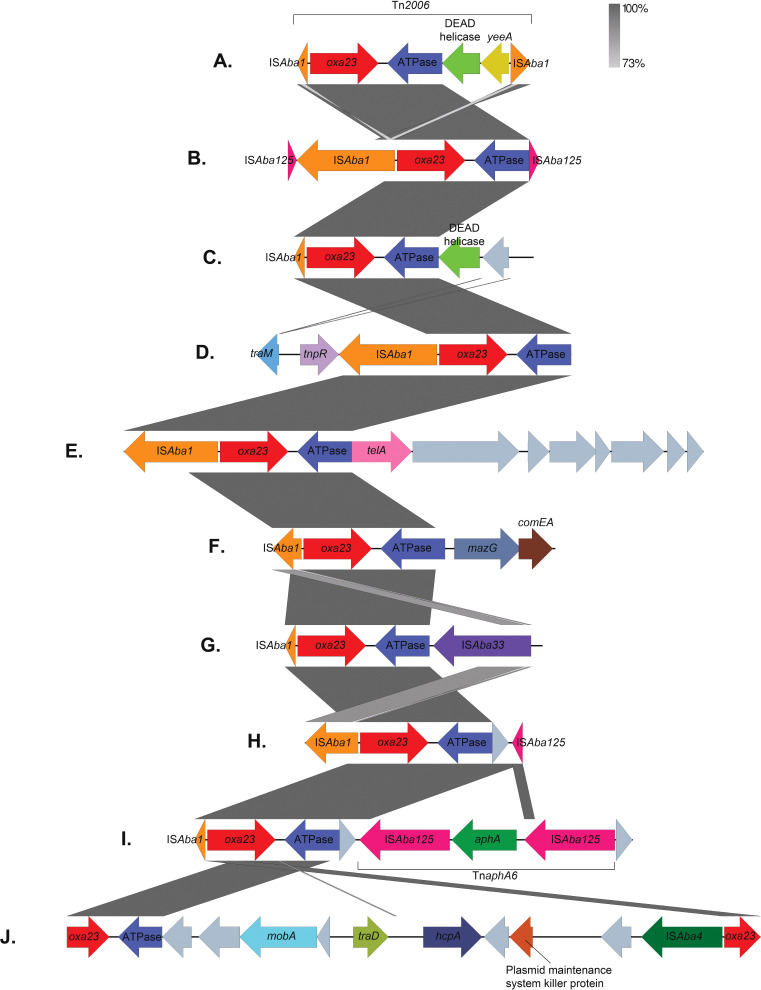
Fig. 3.
Genetic environments surrounding oxa23 genes. Arrows represent genes, which are colour-coded by their type. Unlabelled grey genes represent hypothetical proteins. The size of the genes and the distances between them are drawn to scale. Vertical grey boxes indicate homology between sequences ranging between 73 and 100% identity (blastn). The diagram was created using Easyfig [98] and annotated in Adobe Photoshop.

