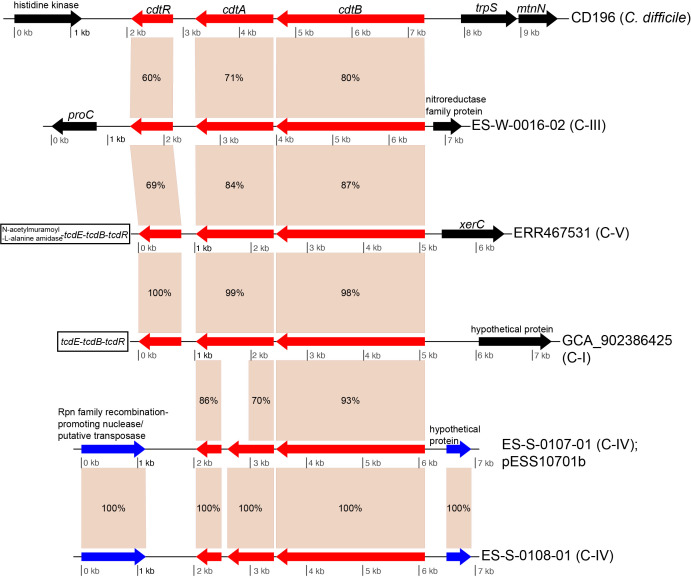
Fig. 4.
Gene map of binary toxin gene regions in genomes from various species. Binary toxin homologues are displayed in red. Binary toxin gene homologues were observed in isolates from clades C-I, C-III, C-IV and C-V. The figure was generated with genoPlotR [54]. Numbers on genes indicate pairwise blast identities. Blue arrows indicate homologous genes outside of the toxin cluster while black boxes indicate genes with no homolog in other gene clusters.

