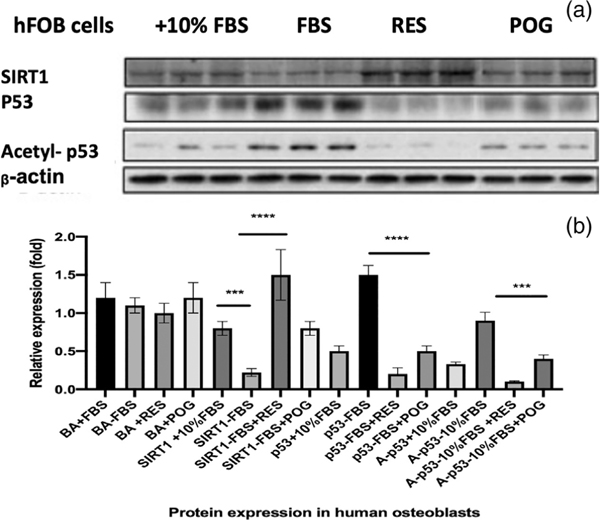
FIGURE 3.
Protein expression levels of SIRT1, p53, and acetylated-p53 from total proteins isolated from control and treated hFOB cells. (a) Total protein was extracted using the Trizol method. The protein expression level of SIRT1, p53, and acetylated-p53 were evaluated by western blot and normalized by β-actin expression rate. The experiments were performed in triplicate. Treatment of the serum-starved (−FBS) cells with resveratrol or peonidin-3-glucoside at 1.0 μg/ml for 72 hr reduced the protein levels of p53 and acetylated-p53 expression. (b) Protein signals were obtained by densitometry and normalized based on total protein concentrations. ***p < 0.001; ****p < 0.0001. BA = beta-actin. Statistics were performed using one-way ANOVA followed by Dunnett’s multiple comparison test using GraphPad 8.2 (San Diego, CA)

