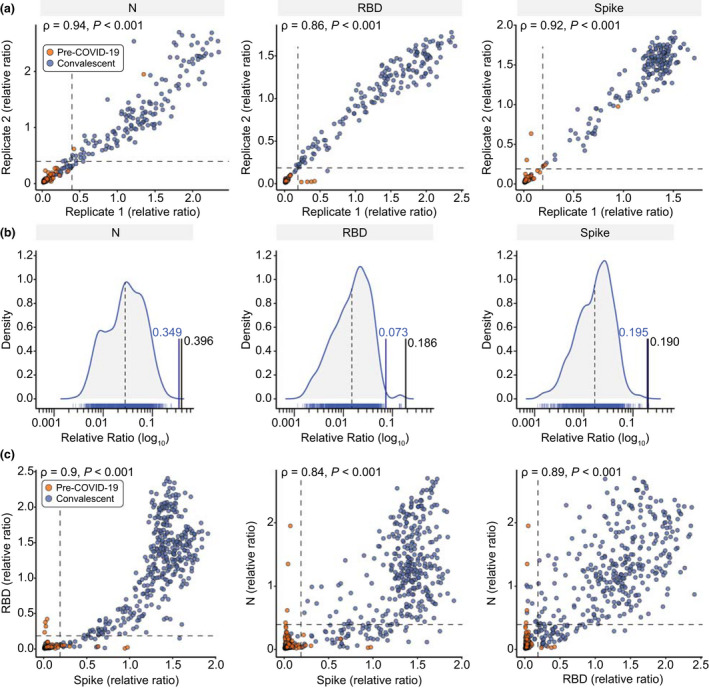
Figure 2.

Development of high‐throughput ELISAs for plasma or serum. (a) Known negative (pre‐COVID‐19) and positive (confirmed convalescent) samples (0.0625 µL/well) were tested in an automated antibody detection ELISA in two separate replicates 7 weeks apart. Spearman correlations are noted. (b) Density distributions of negative samples were plotted for each antigen. The black lines represent the mean of the negative distribution (dotted) and three SDs from the mean (solid; the relative ratio is indicated). The blue line represents the thresholds established by ROC analysis. (c) Comparison of the antigens with a set of known negative and positive samples at 0.0625 µL/well. Spearman correlations are shown. For both a and c, dashed lines represent the thresholds as defined by the 3‐SD negative distribution shown in b and listed in Table 1.
