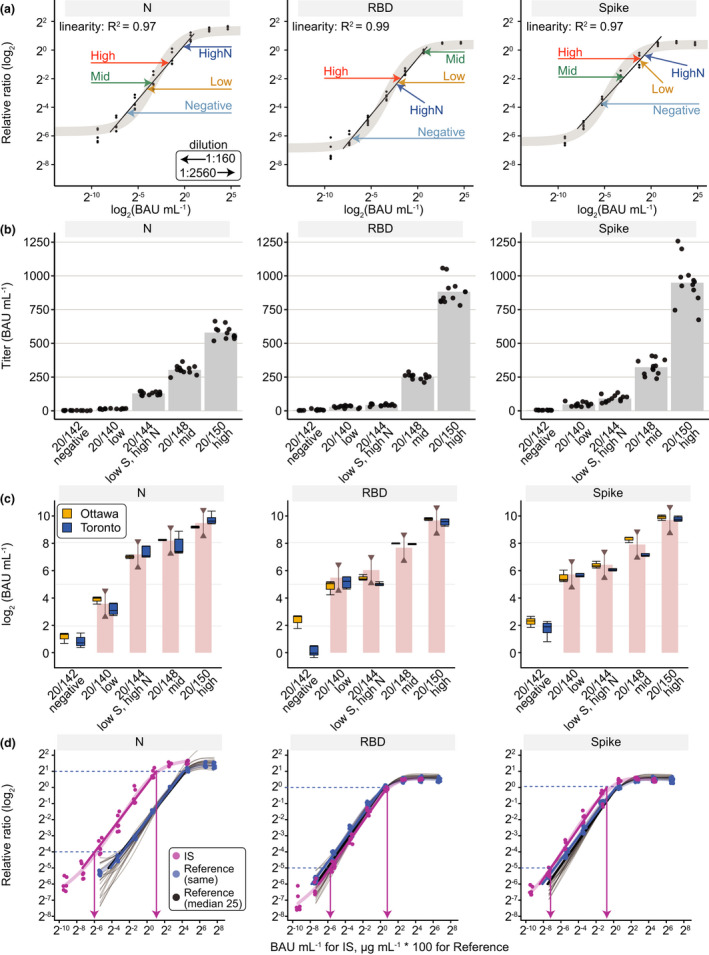
Figure 3.

Conversion of Ottawa and Toronto ELISA data to WHO BAUs and comparison to the WHO Reference Panel 20/268. (a) The 20/268 reference panel at the indicated dilutions (arrows) was fitted onto a dose‐response curve of the IS with the measured values expressed as relative ratios (Toronto). A 1:160 dilution (0.0625 µL/well) of sample was used except when it was out of the linear range of the fitted line in which case the 1:2560 dilution (0.0039 µL/well) was used. (b) IgG levels in the five samples in the 20/268 reference panel are represented for spike, its RBD, and N (n = 12, 4 replicates at 1:500, 1:1000, 1:2500 dilutions). (c) Box plots for Ottawa (orange) show the median of the 12 samples from B. Box plots for Toronto (blue) show the median of individual measurements (n = 4) for the selected dilution (1:2560 (0.0039 µL/well) for Mid and High for spike and N, High for RBD, the rest were at 1:160 (0.0625 µL/well)). The WHO bar graph shows the geometric mean from the WHO study and the lines with half arrows represent a 0.5–2‐fold range from the geometric mean. (d) Reference curves (VHH72‐Fc for spike/RBD, anti‐N for N) were plotted for each antigen either from the same tests in which the IS was analyzed or from 25 different tests over 3 months (shown as faded black lines with a thicker median line in black). The blue dashed lines represent the limits of the linear intervals for the curves and the pink arrows represent the BAU mL−1 at those points. As the reference curves are parallel to the IS within the linear interval, a conversion factor can be applied to convert relative ratios to international BAU mL−1 units (Supplementary table 4). For illustrations purposes to show IS and reference curves in the same panel, the x‐axis is BAU mL−1 for IS and μg mL−1 * 100 for the reference curves.
