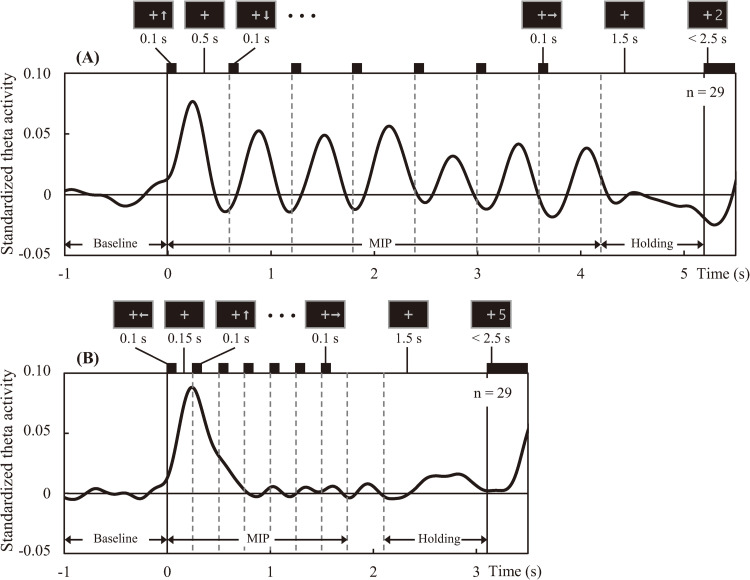
Fig 3.
Mean time courses of standardized theta activity across all sensors; in the slow task (A) and fast task (B). Theta activity amplitude was standardized based on mean activity over the baseline period. Vertical lines indicate the onset times of the arrows (memory items) and recall numbers. Durations of presentation and some examples are shown above each time course.

