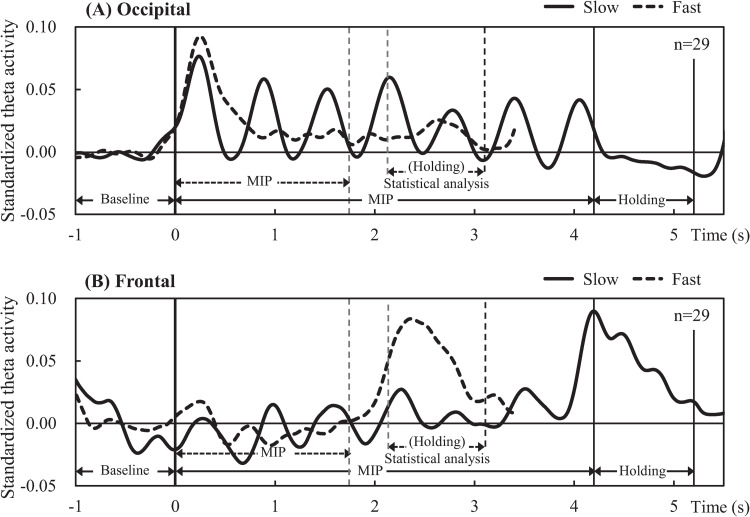
Fig 5. Mean time courses of standardized cortical theta activity in the target regions.
Occipital-theta (A) exhibited prominent peaks after each arrow (memory item) presentation in the slow task (solid line), while exhibiting a prominent peak only after the presentation of the first arrow in the fast task (broken line). Frontal-theta (B) exhibited broad peaks in the holding period in both tasks (solid and broken lines).

