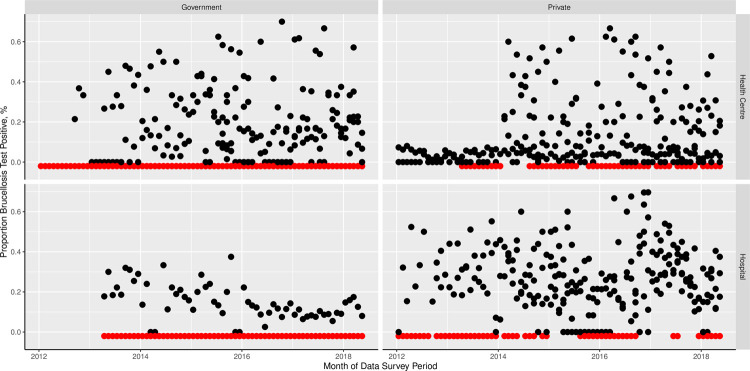
Fig 4. Proportion of individuals tested per month receiving a brucellosis positive laboratory test result over time.
The plots show data from all facilities and months included in the model analyses. Red points just below y = 0 indicate months and facilities in which no brucellosis testing was performed. Panels show the data subset by facility ownership (government or private) and facility classification (health center or hospital).

