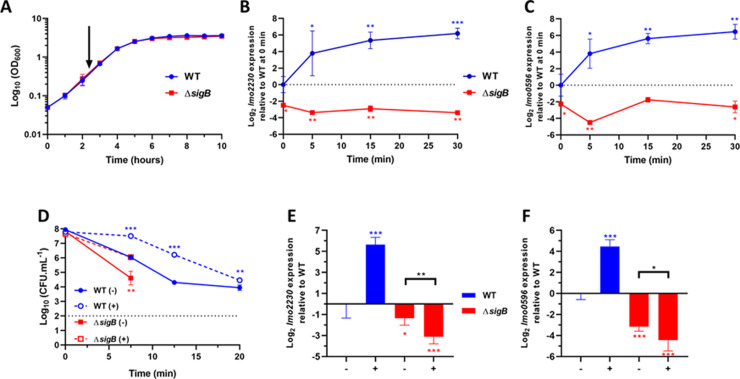
Fig 2. σB-dependent transcription of lmo2230 and lmo0596 is upregulated rapidly under mild acid stress conditions.
(A) Growth curves obtained from Log10 (OD600) measurements of wild type and ΔsigB strains in BHI at 37°C. The arrow points to OD600 = 0.4, the mid-log phase of L. monocytogenes in BHI. Time-lapse expression measurements of the genes (B) lmo2230 and (C) lmo0596 in wild type and ΔsigB strains grown to OD600 = 0.4 and subsequently treated at a mild pH 5.0 (HCl 5 M) at 0 min. Samples were taken at 0, 5, 15 and 30 min post treatment. Results were converted to Log2 relative to the wild type strain at time 0 min. (D) Mid-log phase cultures untreated at pH 7.0 (-) or treat at pH 5.0 (+) for 15 min and subsequently challenged in acidified BHI (pH 2.5). The dashed line represents the detection threshold. Samples were taken at 0, 7.5, 12.5 and 20 min. Survival data is expressed as Log10 (CFU.mL-1). Gene expression of lmo2230 (E) and lmo0596 (F) in wild type and ΔsigB strains grown to OD600 = 0.4. Samples were taken 15 min after untreated (-) or treated (+) at pH 5.0. Gene expression was obtained from RT-qPCR and converted to Log2 gene expression relative to the wild type strain at time 0 min or untreated. Statistical analysis was performed using a paired Student’s t-test relative to the wild type untreated after 15 min, for RT-qPCR data, and untreated wild type at time 0 min, for acid challenge data (*, P value of <0.05; **, P value of <0.01; ***, P value of <0.001).

