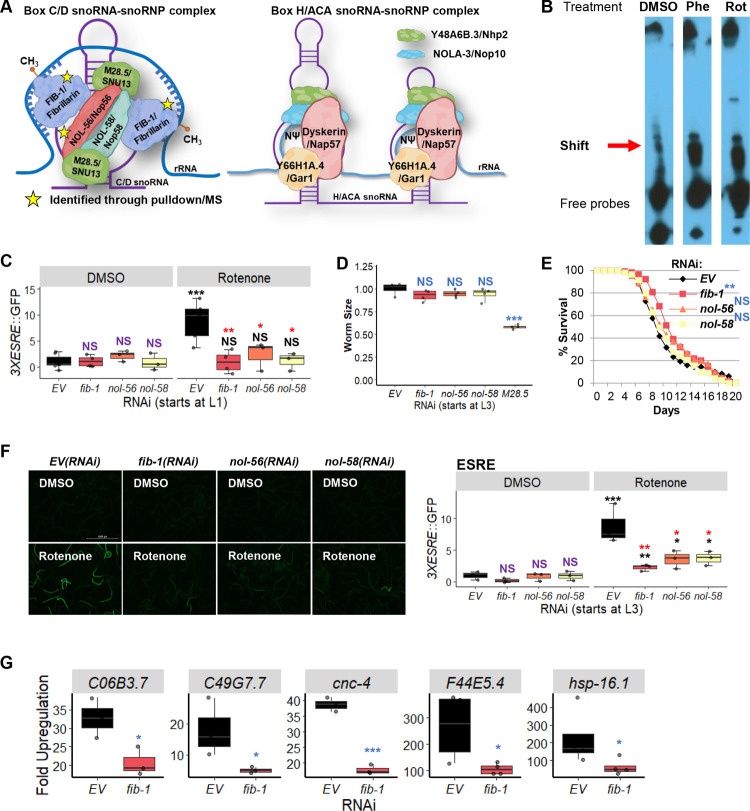
Fig 1. Box C/D snoRNP machinery binds to the ESRE motif.
(A) Cartoon representation of box C/D (left) or box H/ACA (right) snoRNA-snoRNP complexes. Stars indicate proteins identified through oligo pulldown-mass spectrometry. (B) Electrophoretic mobility shift assay (EMSA) showed the presence of the ESRE-binding motif through the identified ‘Shift’. (C) Quantification of GFP fluorescence of C. elegans carrying a 3XESRE::GFP reporter that was reared on E. coli expressing RNAi targeting empty vector (EV) or fib-1(RNAi), nol-56(RNAi), or nol-58(RNAi). (D) The size and (E) lifespan of glp-4(bn2) worms grown on RNAi strains targeting Box C/D snoRNPs are shown. (F) Fluorescent images (left) and quantification of GFP fluorescence (right) of C. elegans carrying a 3XESRE::GFP reporter reared on E. coli expressing RNAi targeting empty vector (EV), fib-1(RNAi), nol-56(RNAi), or nol-58(RNAi). (G) Upregulation of ESRE gene transcripts as measured via qRT-PCR. Worms were reared on E. coli expressing RNAi targeting empty vector (EV) or fib-1(RNAi) and were treated with DMSO or 25 μM rotenone for 8 hours. RNAi treatment was started at the L1 (C) or L3 (D-G) stage. Representative images are shown. Three biological replicates comprised of ~400 (C, D, F), ~150 (E), or ~8,000 (G) worms/replicate were analyzed. A representative replicate for the lifespan assay is shown (E). (C, F) Worms were treated for 8 hours with vehicle (DMSO) or 50 μM rotenone and GFP values were normalized to EV-DMSO. Worms’ sizes were normalized to EV control. p values were determined from two-way or one-way ANOVA for ESRE expression and worms’ size measurement, respectively, followed by Dunnett’s test, log-rank test for lifespan assay, or Student’s t-test for qRT-PCR. NS not significant, * p < 0.05, ** p < 0.01, *** p < 0.001. In panels with colored significance marks, purple indicates comparison between gene(RNAi) and EV(RNAi) in control condition (DMSO), red indicates comparison between gene(RNAi) and EV(RNAi) in stressed condition (rotenone), and black indicates comparison between stressed and control conditions.

