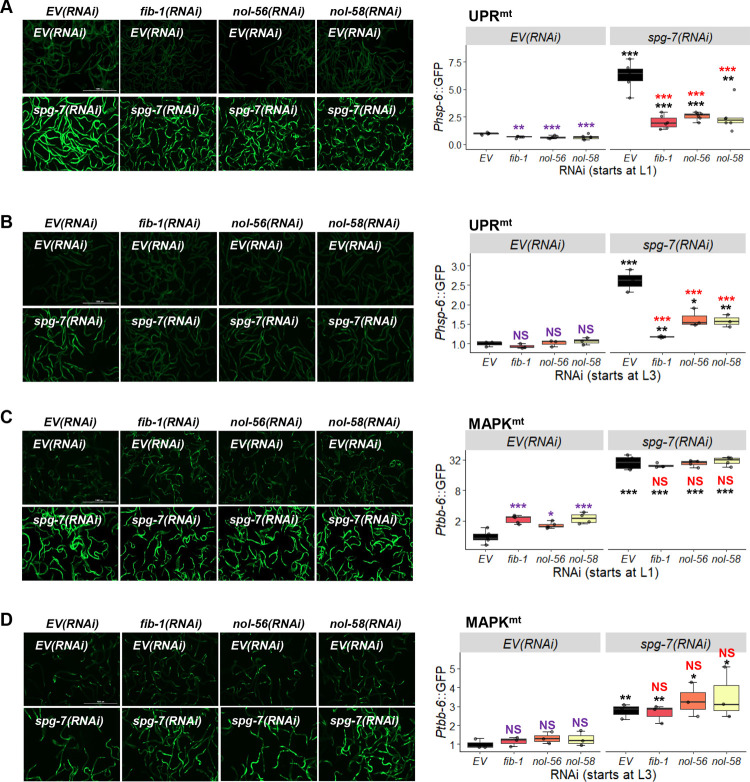
Fig 2. Box C/D snoRNP knockdown reduces UPRmt but increased MAPKmt expression.
(A-D) Fluorescent images (left) and quantification of GFP fluorescence (right) of C. elegans carrying Phsp-6::GFP (A, B) or Ptbb-6::GFP (C, D) reporters reared on E. coli expressing empty vector (EV), fib-1(RNAi), nol-56(RNAi), or nol-58(RNAi). Each RNAi construct was paired with either empty vector (EV) or spg-7(RNAi). RNAi treatment was started at L1 (A, C) or L3 (B, D) stage. Representative images are shown; three biological replicates with ~400 worms/replicate were analyzed. p values were determined from two-way ANOVA, followed by Dunnett’s test, or Student’s t-test. All fold changes were normalized to EV control. NS not significant, *p < 0.05, ** p < 0.01, *** p < 0.001. In all panels, purple significance marks indicate comparison between gene(RNAi) and EV(RNAi) in unstressed condition, red marks indicate comparison between gene(RNAi) and EV(RNAi) in stressed condition (spg-7(RNAi)), and black marks indicate comparison between stressed and unstressed conditions.

