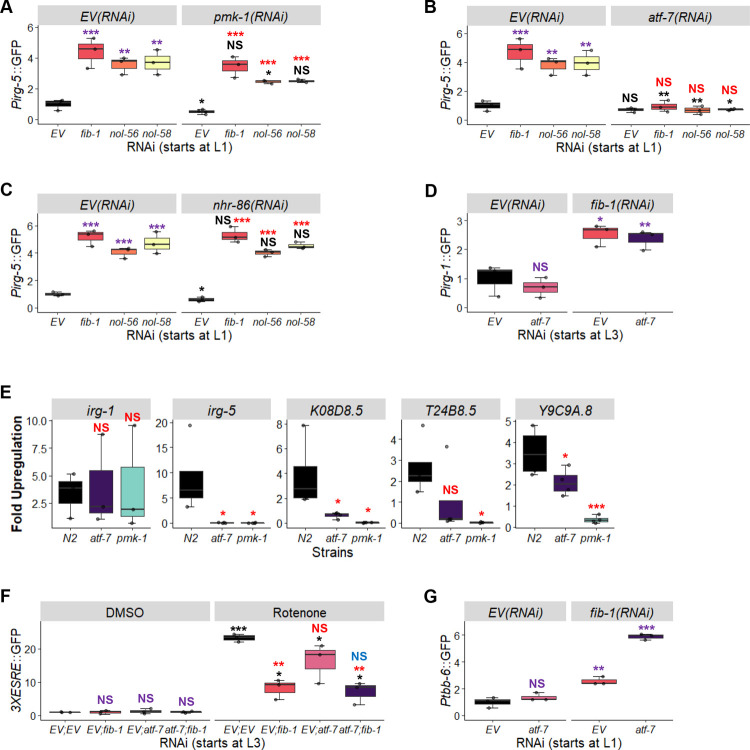
Fig 7. ATF-7 and PMK-1 partially mediate immune responses induced by the loss of C/D snoRNPs but do not affect mitochondrial surveillance pathways.
(A-C) Innate immune activation was quantified by measuring GFP expression in Pirg-1::GFP worms reared on empty vector (EV), fib-1(RNAi), nol-56(RNAi), or nol-58(RNAi) in all pair-wise combinations with empty vector (EV) (A-C), pmk-1(RNAi) (A), atf-7(RNAi) (B), or nhr-86(RNAi) (C). (D) Innate immune activation was quantified by measuring GFP expression in Pirg-1::GFP worms reared on the following RNAi combinations: EV; EV, atf-7; EV, EV; fib-1, or atf-7; fib-1. (E) Expression of the innate immune genes irg-1, irg-5, K08D8.5, T24B8.5, and Y9C9A.8 was measured via qRT-PCR in wild-type (N2), atf-7(gk715), or pmk-1(km25) mutants reared on empty vector or fib-1(RNAi). Gene expression was compared to empty vector controls. (F,G) GFP fluorescence was quantified in worms carrying 3XESRE::GFP (F) or Ptbb-6::GFP (G) reporters reared on EV; EV, atf-7(RNAi); EV, EV; fib-1(RNAi), or atf-7(RNAi); fib-1(RNAi). In (F), worms were exposed to either DMSO (control) or 50 μM rotenone for 8 hours prior to imaging. RNAi treatment was started at the L1 stage (A-C, G) or L3 stage (D-F). Three biological replicates with ~400 (GFP quantification) or ~8,000 (qRT-PCR) worms/replicate were used. p-values were determined from two-way ANOVA, followed by Dunnett’s test, or Student’s t-test for GFP quantification assay, or one-way ANOVA, followed by Dunnett’s test for qRT-PCR data. NS not significant, *p < 0.05, ** p < 0.01, *** p < 0.001. In panels with multi-colored significance marks, purple indicates comparison between gene(RNAi) and EV(RNAi) in control (EV(RNAi) (A-C) or DMSO (F)) conditions. Red indicates comparison between gene(RNAi) and EV(RNAi) in pmk-1(RNAi) (A), atf-7(RNAi) (B), nhr-86(RNAi) (C), or rotenone (F). Black indicates comparison between pmk-1(RNAi) (A), atf-7(RNAi) (B), nhr-86(RNAi) (C), or rotenone (F) to untreated controls in the same panel. Blue indicates comparison between atf-7(RNAi);fib-1(RNAi) and EV;fib-1(RNAi) after rotenone treatment (F).

