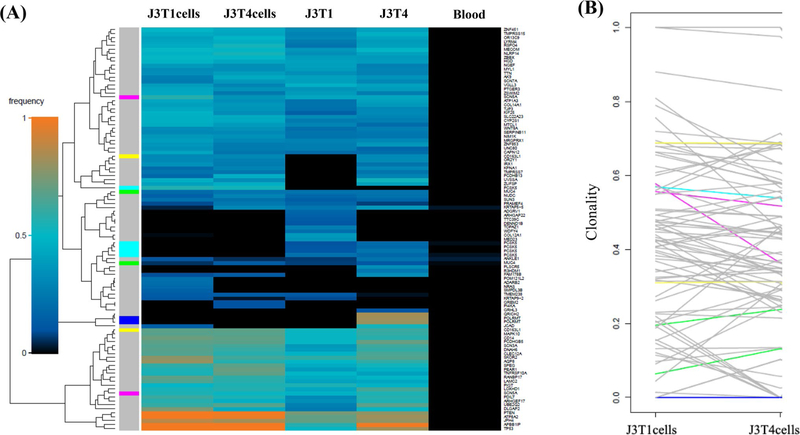
Fig. 2.
J3 superFreq analysis. a Heatmaps comparing presence and frequencies of protein-altering SNVs that change significantly between J3 samples. Genes are assigned unique colors if they are repeatedly mutated (more than one SNV is detected for that gene). b Variant shift analysis charts the differences in relative clonality, or cellular fraction of the sample, across J3 cell lines for each variant detected in the corresponding heatmap. Each variant is represented by an individual line

