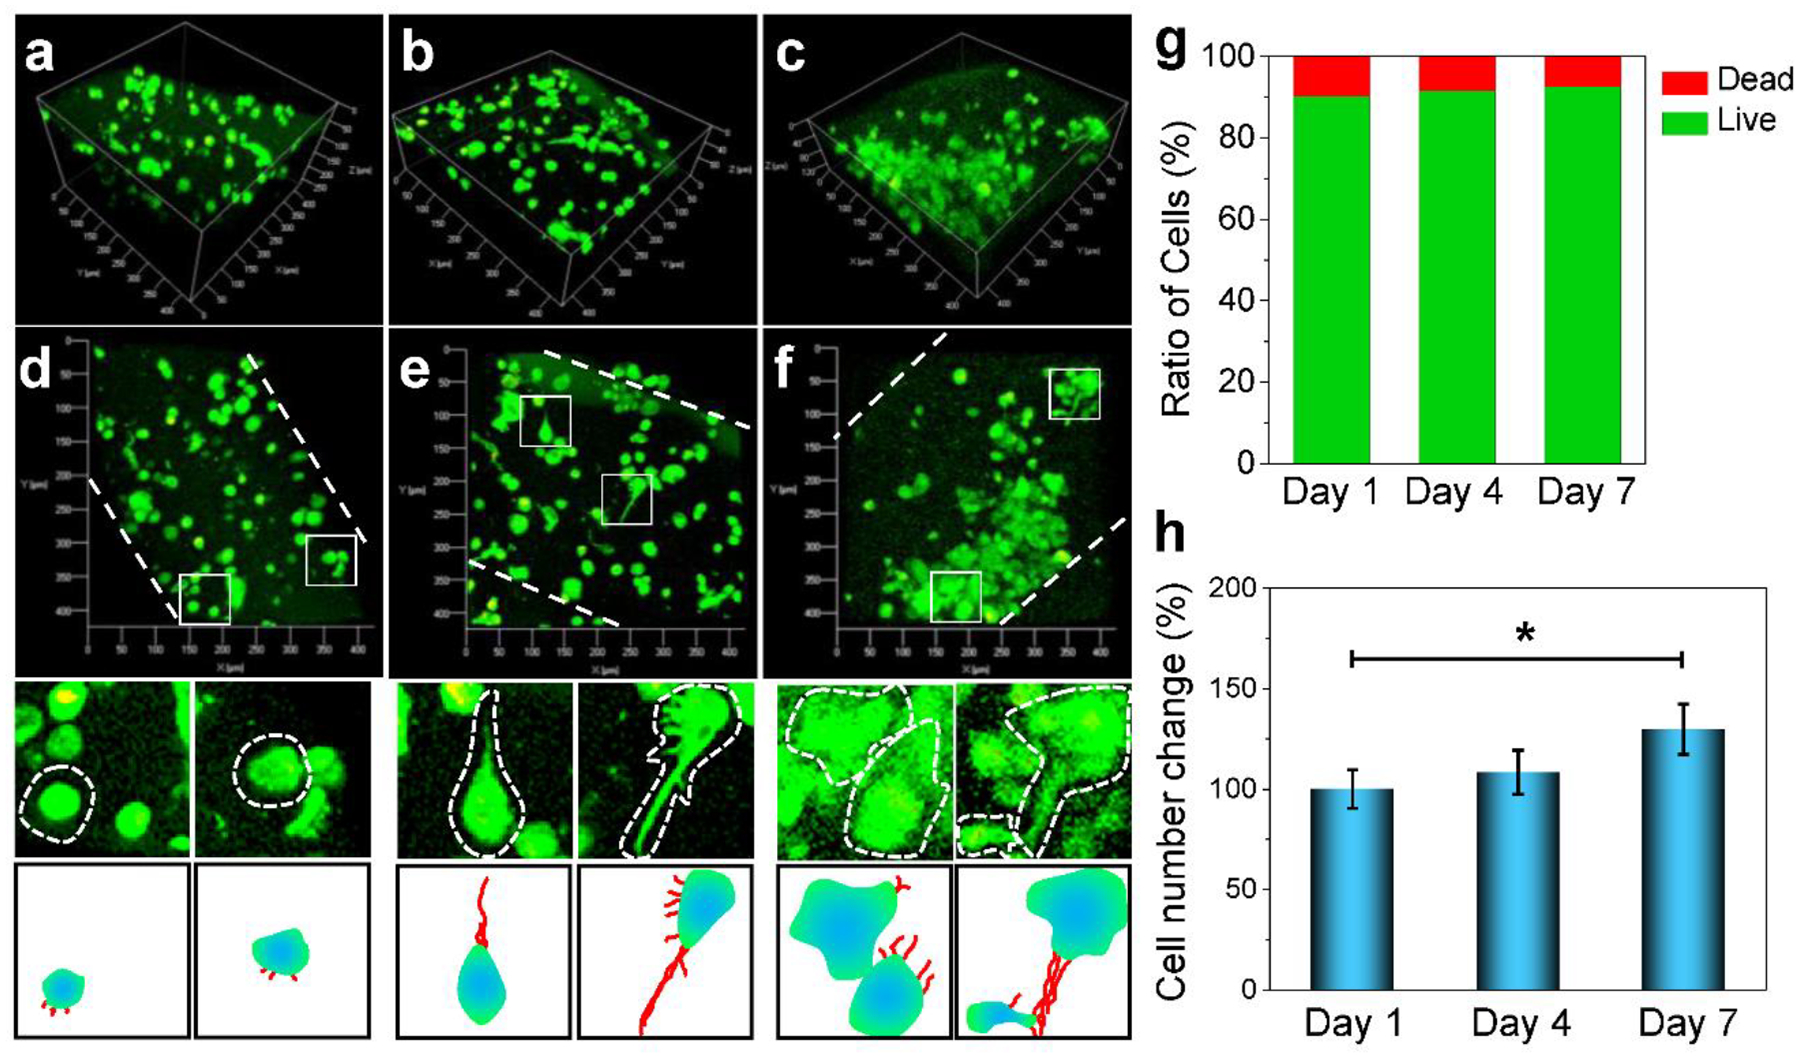
Fig. 6.

Confocal imaging. 3D imaging of the distribution of MC3T3 pre-osteoblast cells encapsulated in the bioprinted scaffolds at a) day 1, b) day 4 and c) day 7 of culture in α-MEM. 2D cell morphological features with enlarged view of single cell from the above confocal images and schematic demonstration of cell projections within the bioink at d) day 1, e) day 4 and f) day 7 of culture. g) The MC3T3 live cell and dead cell ratios. h) MC3T3 cell number changes at day 1, 4, 7 days of culture (*: p < 0.05).
