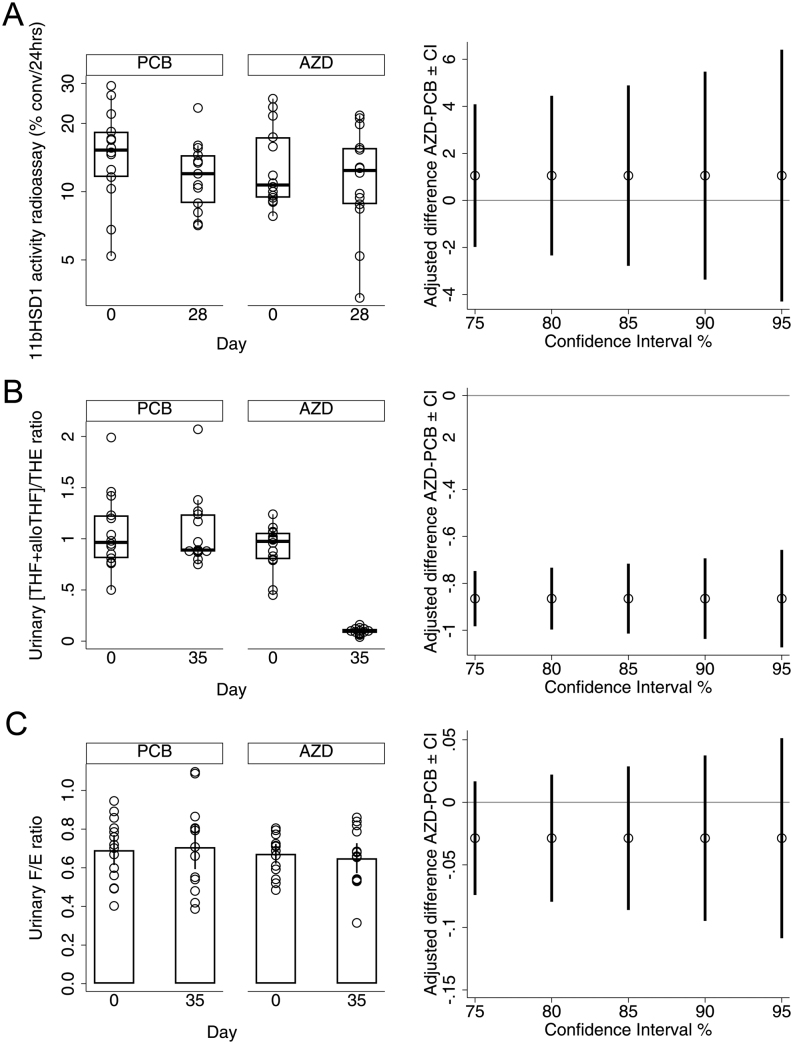
Figure 2.
Efficacy outcome measures. Population: Full analysis set. (A) Box plots of observed skin 11β-HSD1 activity (percent conversion (conv) per 24 h measured by radioassay) (left panel) and adjusted differences between placebo (PCB) and AZD4017 (AZD) medians at day 28 with CIs estimated in imputed data (right panel). (B) Box plots of observed urinary (THF+alloTHF)/THE ratio (left panel), indicative of systemic 11β-HSD1 activity and adjusted differences between medians at day 35 with CIs estimated in imputed data (right panel). (C) Means and 90% CIs for observed urinary cortisol/cortisone (F/E) ratio (left panel), indicative of systemic 11β-HSD2 activity and adjusted differences between means at day 35 with CIs estimated in observed data (right panel). Solid lines indicate no difference.

 This work is licensed under a