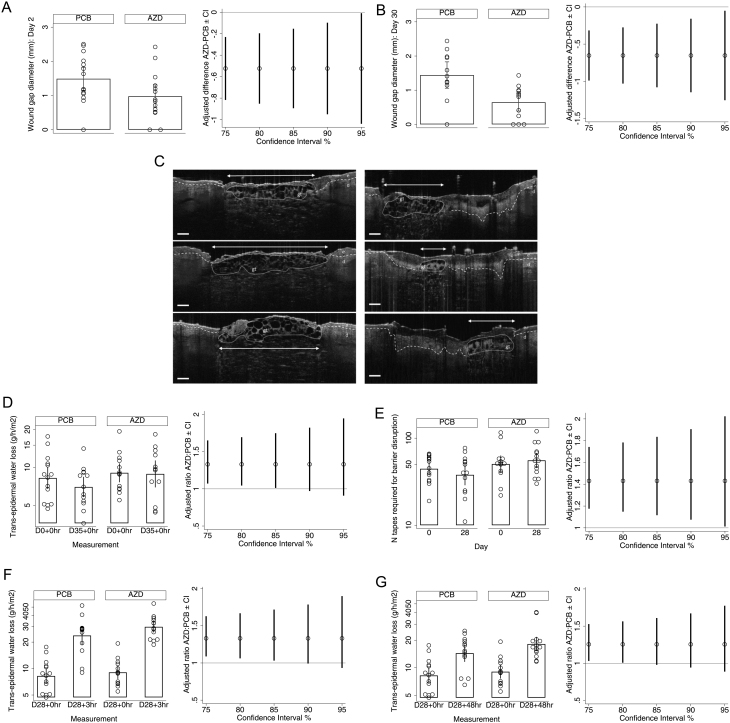
Figure 3.
Skin outcome measures. Population: Full analysis set. (A, B, D, E, F, and G) Means and 90% CIs for observed values (left panel) and adjusted differences between PCB and AZD means with CIs estimated in imputed data (right panel). TEWL and integrity readings were log-transformed before analysis; therefore, geometric means and ratios are provided for these variables. Solid lines indicate no difference. (C) Representative day 2 biopsy wound healing optical coherence tomography images (after 2 days of treatment). Maximal early granulation tissue width (arrow) was measured for participants treated with PCB (left panel) or AZD4017 (right panel). Wide dashes indicate dermal–epidermal junction. Scale bar: 250 µm. AZD, AZD4017; d, dermis; e, epidermis; gt, granulation tissue; PCB, placebo; TEWL, transepidermal water loss.

 This work is licensed under a