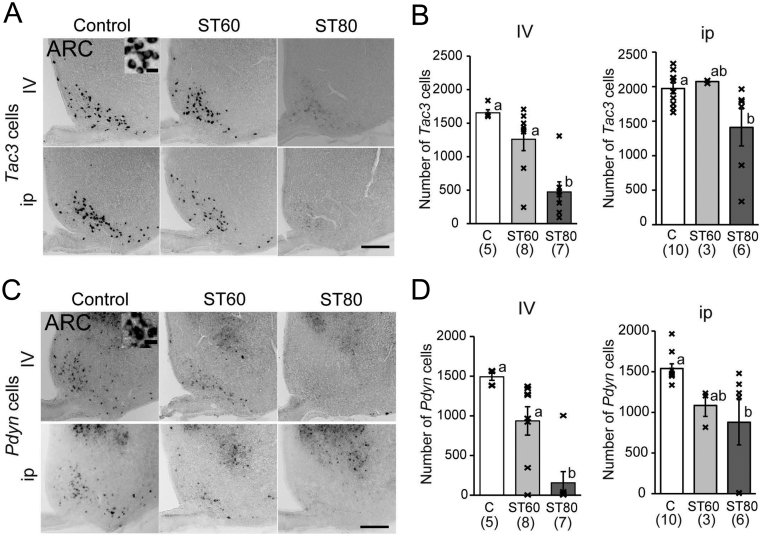
Figure 3.
Expression of Tac3 and Pdyn by ISH in the arcuate nucleus (ARC) in E2-treated ovariectomized rats. (A, B) Representative photos and the number of Tac3 mRNA-expressing cells in the ARC. (C, D) Representative images and the number of Pdyn mRNA-expressing cells in the ARC. Scale bar = 200 μm. Two insets show higher magnification of certain cells. Scale bar of insets = 20 μm. Numbers in parenthesis under each column represent the number of rats examined. Values with different letters are significantly different among each group (P < 0.05, one-way ANOVA followed by Tukey’s test). Values are expressed as mean ±s.e. of the mean. Marks in each bar graph show individual values.

 This work is licensed under a