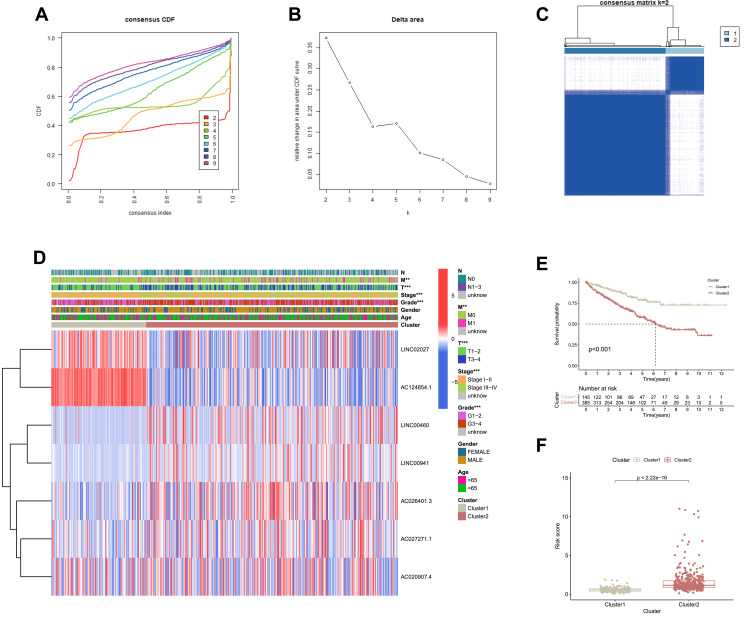
Figure 7.
Differential clinicopathological features and survival of ccRCC in two clusters. (A) Consensus clustering cumulative distribution function (CDF) for k = 2–10. (B) Relative change in area under CDF curve for k = 2 to k = 10. (C) Consensus clustering matrix for k = 2. (D) Heatmap and clinicopathologic features of the two clusters (cluster 1 and cluster 2). (E) Kaplan-Meier curves of OS for patients with ccRCC in the two clusters. (F) Boxplot of risk score derived from the FRLs prognostic signature in the two clusters. **p < 0.01, ***p < 0.001.

