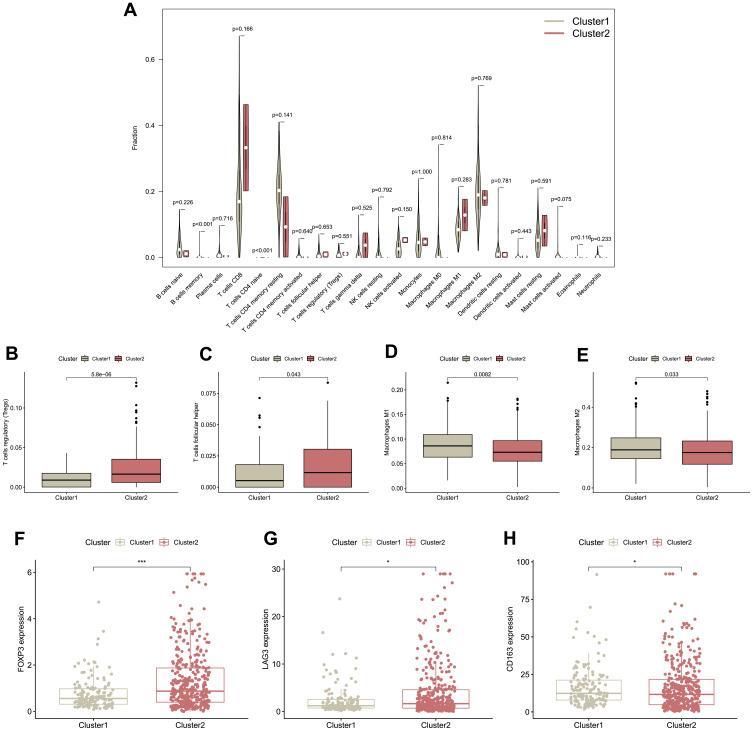
Figure 8.
Comparison of immune signatures between the two ccRCC subgroups. (A) Comparison between two clusters of 22 immune cell proportions, visualized in the violin plots. (B–E) Comparison of several specific immune cells that had statistically significant differences of infiltration levels between the two clusters (Tregs, T cells follicular helper, Macrophages M1 and Macrophages M2). (F–H) The expression levels of marker gene of Tregs and Macrophages M2 (FOXP3 and LAG3: the marker of Tregs; CD163: the marker of Macrophages M2). *p < 0.05, ***p < 0.001.

