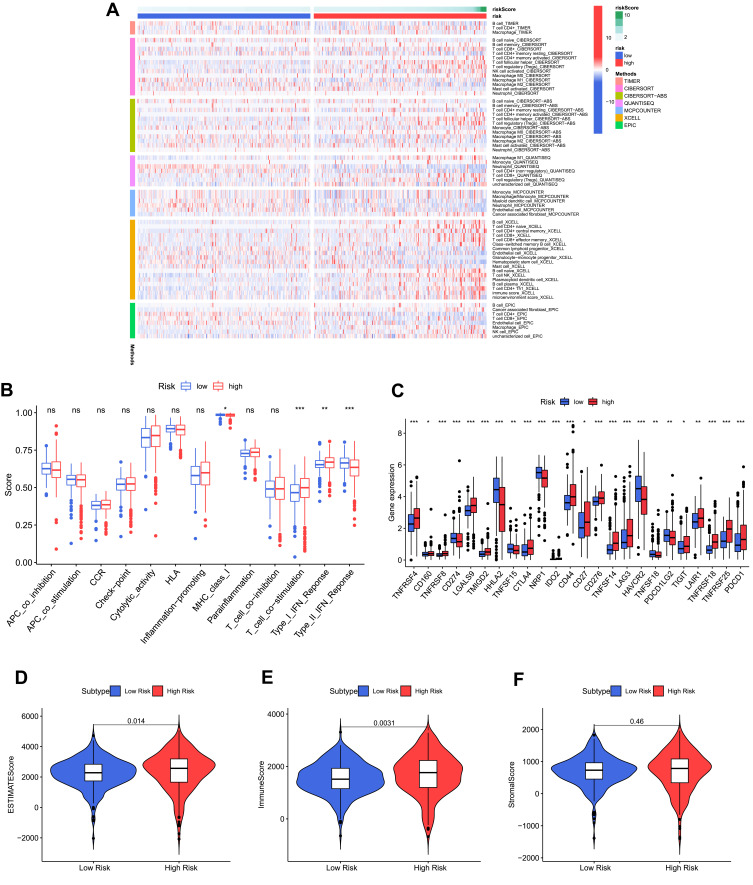
Figure 10.
Immunity and gene expression. (A) Based on TIMER, CIBERSORT, CIBERSORT−ABS, QuanTIseq, MCPcounter, xCell and EpiC algorithms, heatmap of immune infiltration in the high- and low-risk groups. (B) ssGSEA for the association between immune cell subpopulations and related functions. (C) Expression of immune checkpoints among high- and low-risk groups. (D–F) ESTIMATE score, immune score and stromal score in the high- and low-risk groups. *p < 0.05, **p < 0.01, ***p < 0.001.

