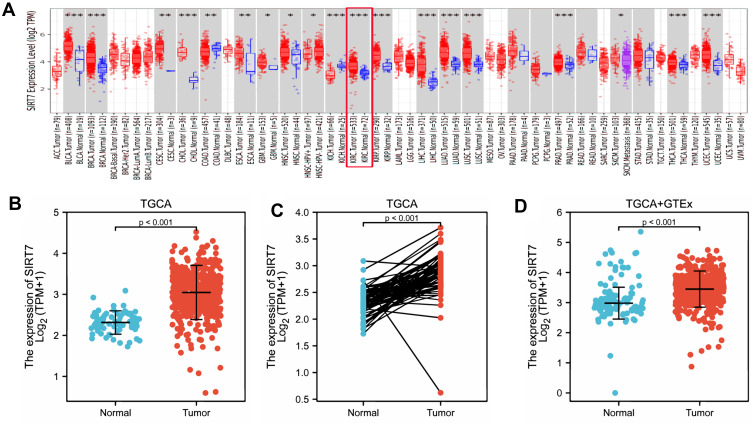
Figure 1.
The expression of SIRT7 in KIRC. (A) SIRT7 levels were assessed in different tumors in the TIMER database (*P <0.05, **P < 0.01, ***P < 0.001). (B) SIRT7 expression was compared in tumor tissue and control tissue samples in the TCGA database. (C) SIRT7 expression levels were compared for paired tumor and control tissue samples from the TCGA database (P <0.001). (D) Differences in SIRT7 expression between normal tissues from the GTEx database and control and normal tissues from the TCGA database were assessed via WRST.

