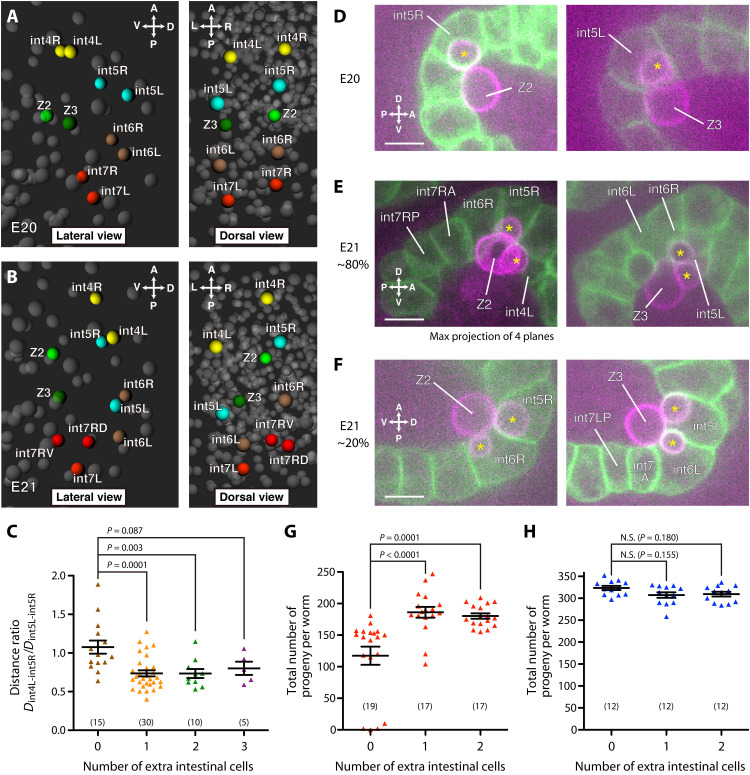
Fig. 2. Extra cells coincide with left-right asymmetric development, increasing the primordial germ cell–intestine association.
(A and B) Three-dimensional reconstruction of centers of cell nuclei around the mid-intestine of 1.5-fold stage embryos. An embryo without extra cell (A) (E20) and one with an extra cell (B) (E21), whose mothers experienced CBX102. Left: lateral view. Right: dorsal view. Yellow, int4L/R cells; cyan, int5L/R cells; brown, int6L/R cells; red, int7L/R cells and int7R daughters; yellow-green, Z2; green, Z3; gray, other cells. (C) Ratios of the distance between int4L and int5R (Dint4L-int5R) to that between int5L and int5R (Dint5L-int5R) in embryos whose mothers experienced CBX102. ANOVA with Dunnett’s posttest [F(3,56) = 7.147, P = 0.0004]. The numbers of embryos are indicated in parentheses. (D to F) Embryo without extra cell (D) and embryos with one extra cell (E and F), whose mothers experienced CBX102. Green, intestinal cell membranes; magenta, PGC membranes. Single focal plane images are shown unless otherwise indicated. Left: Z2 and its lobes (asterisks). Right: Z3 and its lobes (asterisks). Scale bars, 10 μm. (G and H) Numbers of total progeny from worms grown on mixture of 10% CBX102 and 90% OP50 (G) and 100% OP50 (H). Intestinal cell numbers were determined in F1 worms born to mothers that had experienced CBX102, and numbers of F2 progeny of individually cultured F1 worms were counted. Kruskal-Wallis and Dunn’s posttest [(G) P < 0.0001; (H) P = 0.1356]. N.S., not significant. Each dot represents one F1 worm. The numbers of F1 worms tested are indicated in parentheses. (C, G, and H) Bars represent means ± SEM.

