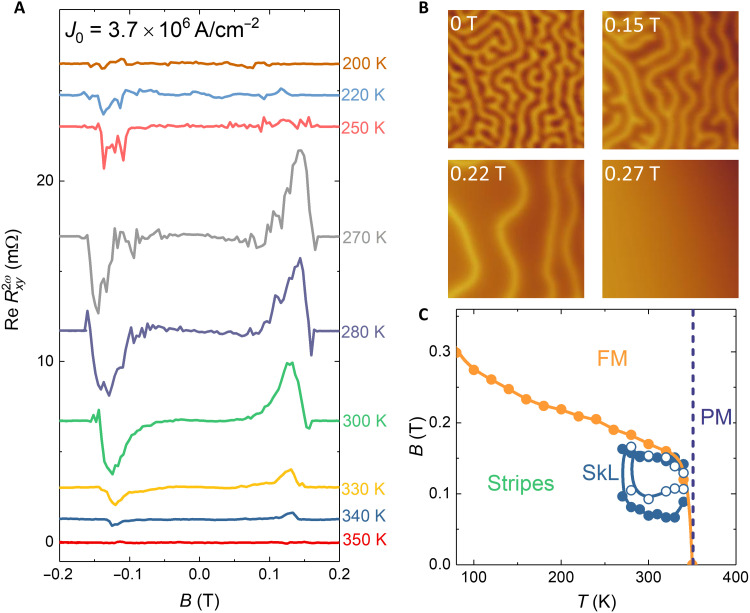
Fig. 6. Phase diagram.
(A) Magnetic field dependence of the real part of second-harmonic Hall resistance at various temperatures. (B) MFM images on a 261-nm nanoflake were taken in 0, 0.15, 0.22, and 0.27 T at 200 K, respectively. The color scales of MFM images are 1.6, 5.5, 6, and 0.2 Hz, respectively. The size of the images is 5 μm by 5 μm. The lift height is 150 nm. (C) Phase diagram of FCGT as a function of temperature and magnetic field obtained in 136-nm-thick nanoflakes. The blue, green, yellow, and purple areas represent skyrmion lattice (SkL), stripe, ferromagnetic (FM), and paramagnetic phases (PM), respectively. The solid and empty circles correspond to the results of the second-harmonic Hall resistance measured by 3.7 × 10⁶ and 2.7 × 10⁶ A/cm−2, respectively.

