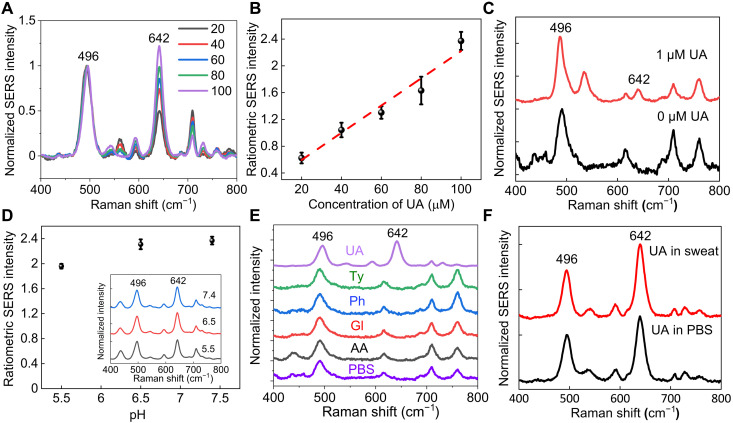
Fig. 4. Sensitivity and specificity of UA detection and quantification.
(A) SERS spectra of UA of varying concentrations averaged from six spectra for each concentration. (B) Calibration curve of ratiometric SERS intensity for UA quantification. (C) SERS spectra of 0 and 1 μM UA collected from AuNR paper. (D) Ratiometric SERS intensity of 100 μM UA at different pH conditions. Inset shows corresponding SERS spectra. (E) SERS spectra of 100 μM UA, tyrosine (Ty), phenylalanine (Ph), glucose (Gl), ascorbic acid (AA), and 1× PBS. (F) SERS spectra of UA in 1× PBS and artificial sweat.

