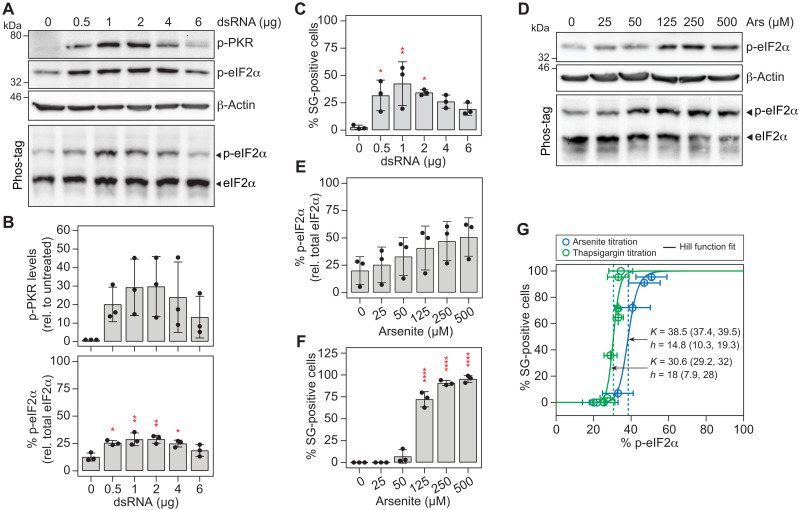
Fig. 3. SG formation is a switch-like process.
(A to C) Activation of PKR in Huh7 YFP-TIA1 cells transfected with increasing amounts of 200-bp dsRNA (n = 3). (A) Representative Western blot analysis of p-PKR and p-eIF2α expression levels. Expression levels of β-actin served as loading control. The percentage of p-eIF2α was analyzed by Phos-tag polyacrylamide gel. (B) Shown are quantifications of mean p-PKR expression levels (±SD) normalized to the loading control and relative to untreated cells (top) and quantifications of the mean p-eIF2α percentage (±SD). Statistical significance is indicated compared to untreated cells. (C) The presence of SGs in transfected cells was analyzed by fluorescence microscopy (for each condition, n > 100). Shown are mean percentages ± SD. Statistical significance is indicated compared to untreated cells. *P < 0.05, **P < 0.01. (D to F) Induction of oxidative stress in Huh7 YFP-TIA1 cells by treatment with increasing concentrations of arsenite for 45 min (n = 3). (D) Representative Western blot and Phos-tag analyses. Shown are mean percentages ± SD of p-eIF2α (E) and SG-positive cells (for each condition, n > 100) (F). Statistical significance is indicated compared to untreated cells; ****P < 0.0001. (G) Dose-response analysis and determination of the p-eIF2α level that results in formation of SGs in 50% of cells upon treatment with arsenite [related to (F); n = 3] and thapsigargin (related to fig. S4, E to H; n = 3).

