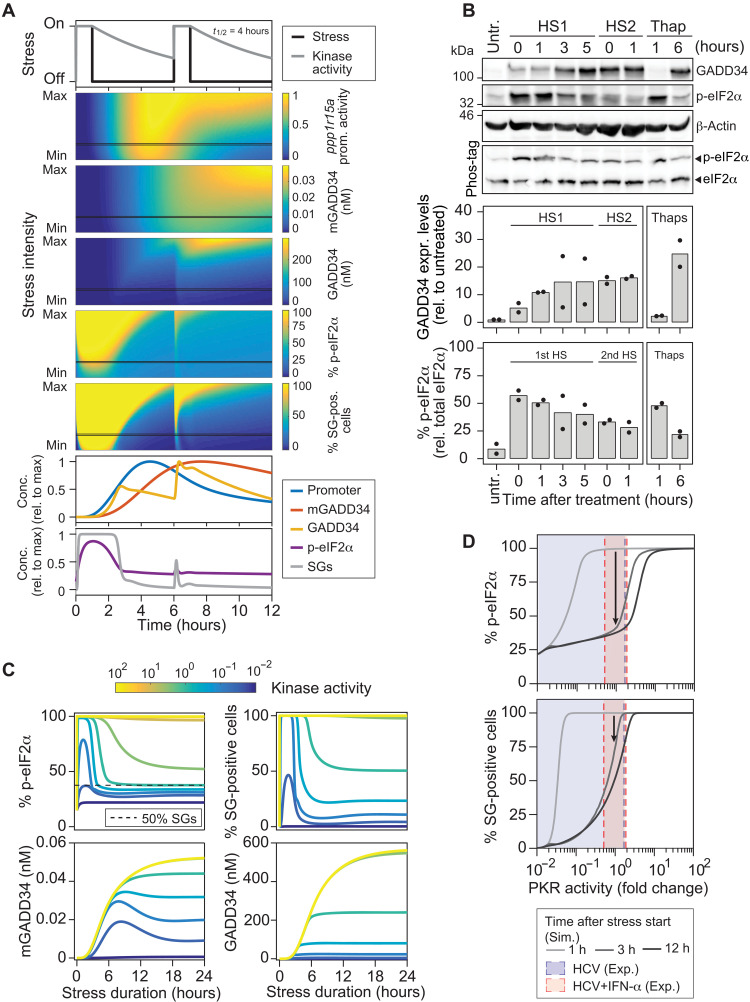
Fig. 6. Cell adaptation to repeated and continuous stress.
(A) Computational simulations of two consecutive 1-hour stress pulses interspaced by a 5-hour recovery period. Shown is a range of stress kinase activities (stress intensity) varying between 10-fold lower (min) and 10-fold higher (max) than the reference kinase activity leading to 50% SG-positive cells. Color plots show the behavior of ppp1r15a promoter activity, concentrations of GADD34 mRNA and protein, and percentages of p-eIF2α and SG-positive cells. Graphs at the bottom reflect the behavior of the abovementioned components for one chosen stress intensity (black line, moderate stress). (B) Experimental validation of the predictions shown in (A). Huh7 cells were subjected to a first heat shock (HS1) at 42°C for 1 hour and immediately transferred at 37°C for recovery. Cells were harvested at the indicated time points after the first or the second heat shock (HS2) (n = 2). Cells treated with 2 μM thapsigargin for 1 and 6 hours served as reference. Shown are representative Western blot and Phos-tag gel analyses. Bottom panels show the quantification of GADD34 expression levels normalized to the loading control and relative to untreated cells as well as the percentage of p-eIF2α. (C) Model prediction: behavior of the SG response and GADD34 negative feedback loop components over a 24-hour time period upon continuous stress. The color of the curves reflects different kinase activity levels. (D) During the adaptation to a stress stimulus, depending on PKR activity, the expression of GADD34 will result in dose-response curve shifts (hysteresis) in the percentage of p-eIF2α (top) and of SG-positive cells (bottom). The shift of the dose-response curve depends on the stress duration and intensity and is reverted after stress relief. Blue and red shared areas indicate 1σ confidence intervals of estimated PKR activities in HCV and HCV + IFN-α experiments.

