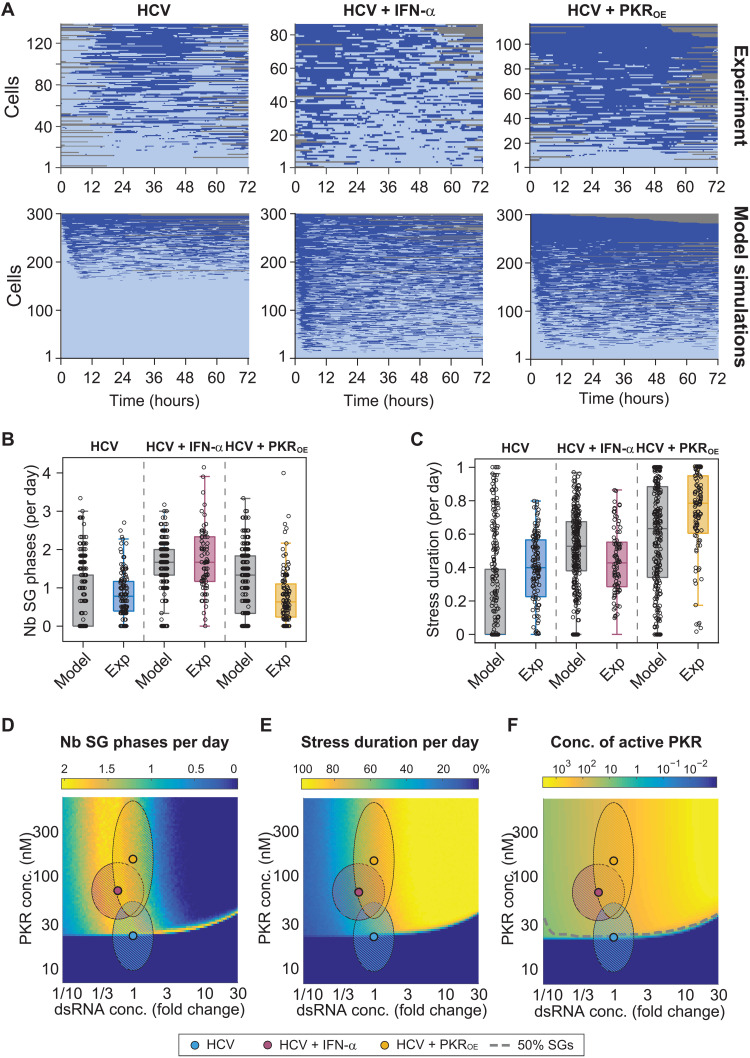
Fig. 7. Stochastic mathematical model of the ISR recapitulates HCV-induced SG response dynamics.
(A to C) Comparison of experimental and computational simulations of 3-day single-cell SG response time series using the parameters estimated in HCV-infected cells in the presence and absence of IFN-α, and in HCV-infected Huh7 PKROE cells (bottom, n = 300) (A). Corresponding number of SG phases per day (B) and stress duration per day (C) were compared. Boxes indicate 25th and 75th percentiles around the median. (D to F) Computational simulations of average SG phases per day (D), stress duration per day (E), and concentration of active PKR (F) for varying PKR and dsRNA concentrations. DsRNA concentrations are expressed as fold changes relative to conditions of the HCV experiment (simulations of 500 single-cell trajectories per combination; hatched ellipsoid areas: 95% confidence intervals for HCV and HCV + IFN-α experiments).

