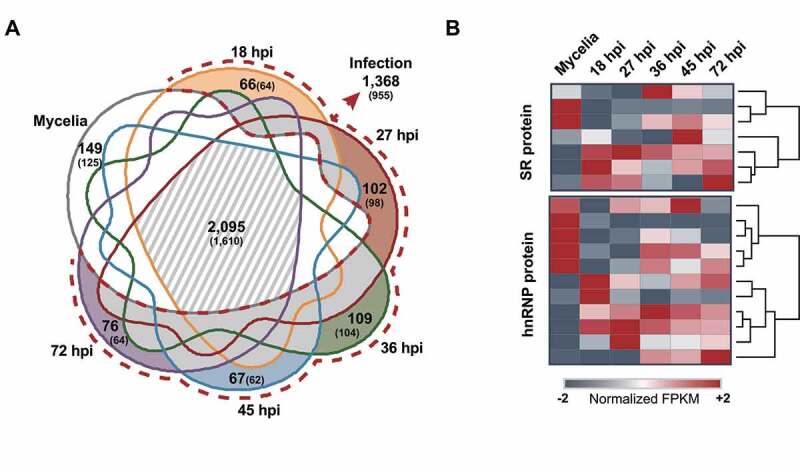
Figure 2.

AS repertoires and the expression patterns of putative AS regulator genes under different conditions.
(a) Venn diagram showing the number of AS isoforms and genes (in parenthesis) at each stage. The light grey dashed region denotes the AS isoforms produced in mycelia as well as during infection (2,095). Each stage is colour-coded: mycelia (grey line), pre-penetration (yellow line), biotrophic (red and green line), and necrotrophic (blue and purple line). The stage-specific isoforms are colour coded. The AS isoforms detected only during infection are shown in a dashed red line. (b) Heatmap showing how the SR and hnRNP protein-coding genes are expressed under these conditions.
