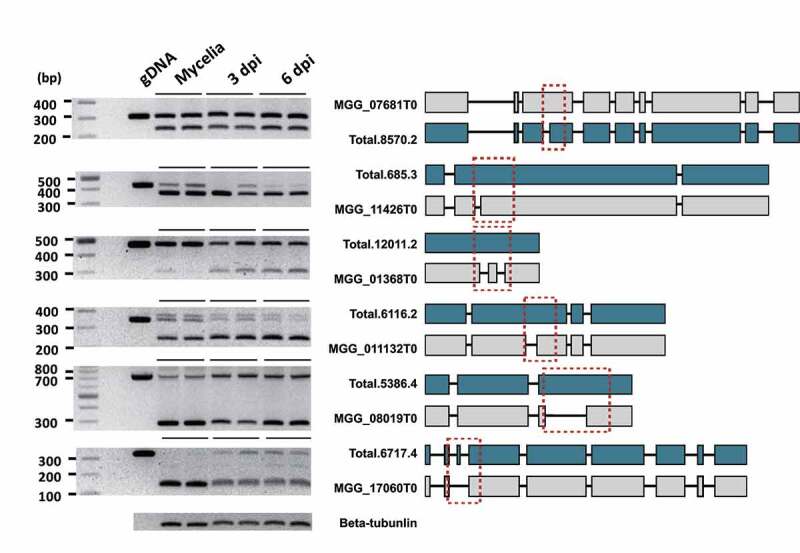
Figure 7.

Validation of the transcripts produced via AS and the resulting structural changes.
AS of selected genes was validated using RT-PCR. The samples analysed are mycelia and rice leaves collected at 3 days post-inoculation (dpi) and 6 dpi. Genomic DNA was used as the control for RT-PCR reactions. The structural differences between the annotated form (grey) and isoform (blue) are shown. The red boxes indicate the amplified regions of DNA and cDNA.
