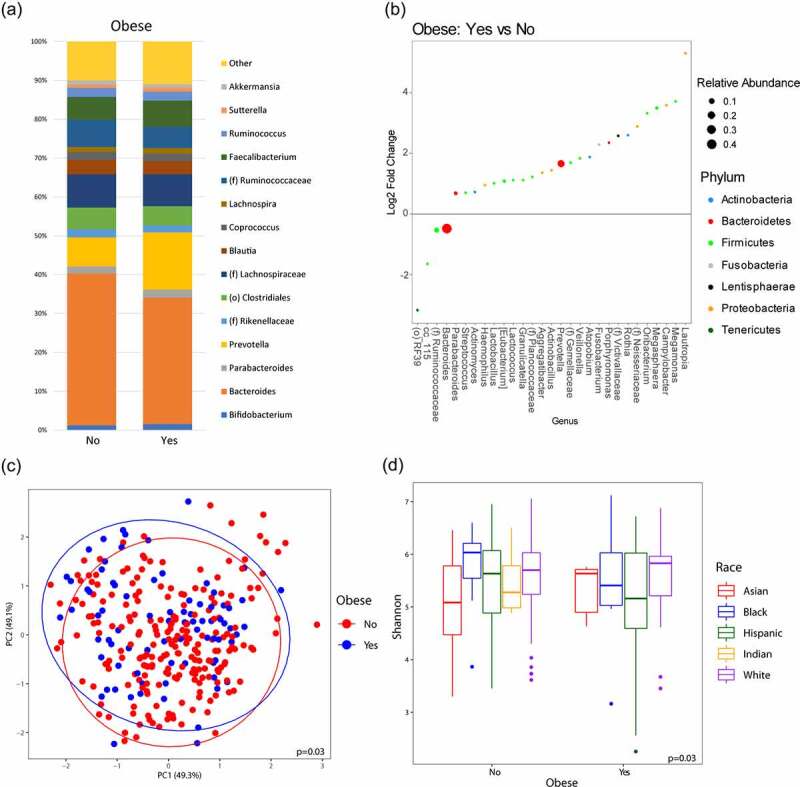
Figure 1.

Microbiome diversity and composition varies with obesity. (a) Taxonomic summary plots showing relative abundance of all genera (minimum of 1% relative abundance) grouped by obesity, adjusting for sex, race and diet. (b) Log2 fold changes for genera with differential abundance between obese vs. non-obese in DESeq2 models (q < 0.05), adjusting for race and diet. (c) Principal coordinate analysis plot of the microbiome based on obesity encircled by 99% confidence interval ellipses, adjusting for sex, race and diet. (d) Box plot of microbial diversity by Shannon index (measure of richness and evenness) grouped by obesity and stratified by race, adjusting for race, diet, and sex.
