
Figure 4.
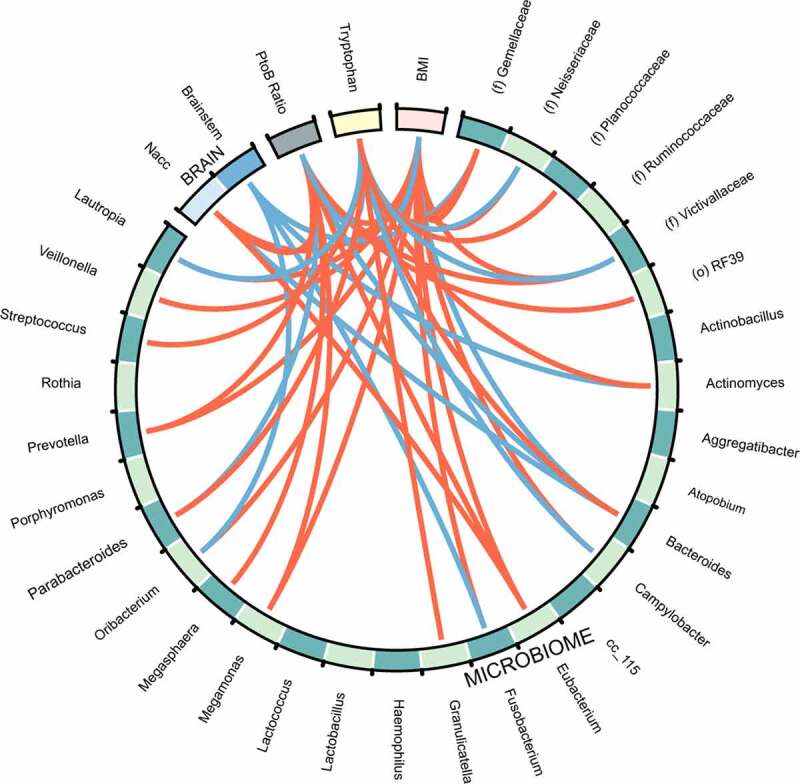
Circos plot of all datasets. Red lines indicate positive correlations and blue lines indicate negative correlations (False discovery rate cutoff = 0.10). Bacteria to Bacteria associations were excluded from this plot for easier viewing. Nacc: Nucleus accumbens; BMI: Body mass index. P/B: Prevotella/Bacteroides. The strength of the correlations can be found in supplemental table S3.