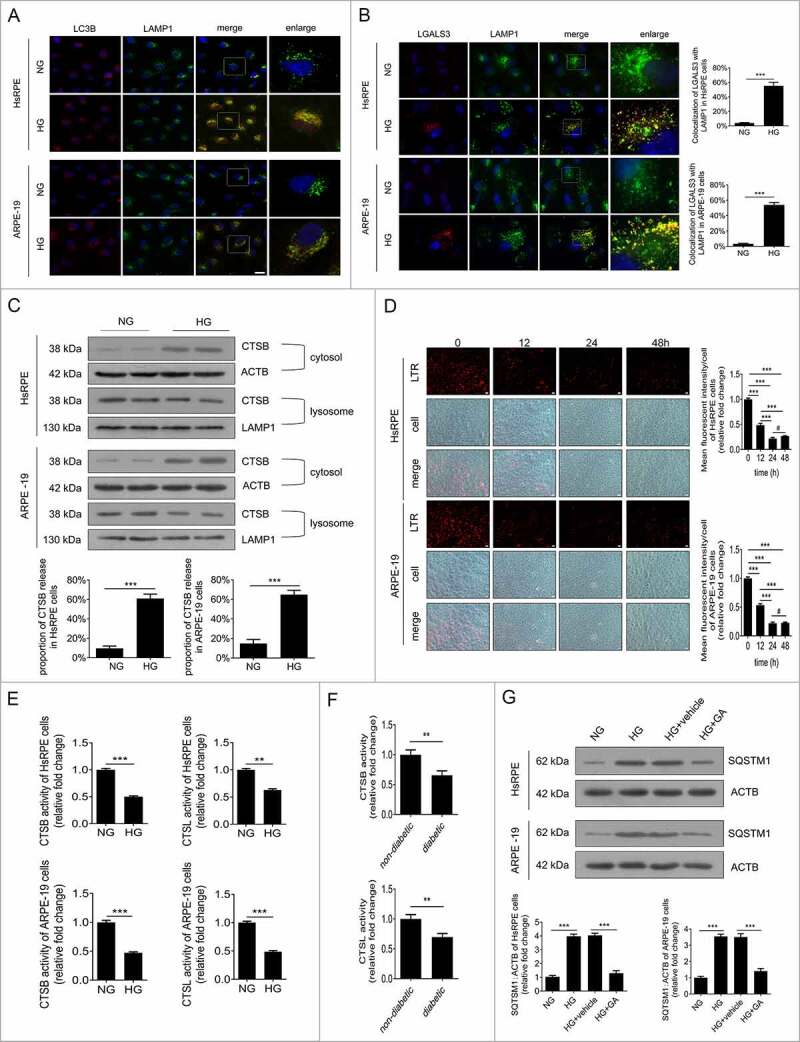
Figure 3.

Lysosome membrane permeabilization (LMP) contributed to HG-triggered autophagic dysfunction in RPE cells. (a) Immunofluorescence signals after double-staining for LC3B (red) and LAMP1 (green) in HsRPE and ARPE-19 cells after exposure to NG or HG for 24 h. Representative images from three independent experiments with biological and technical replicates are shown. Scale bars: 25 μm, n = 6. (b) Immunofluorescence signals after double-staining for LGALS3 (red) and LAMP1 (green) in HsRPE and ARPE-19 cells after exposure to NG or HG for 24 h, and Manders’ coefficients for colocalization of LGALS3 with LAMP1. Representative images from three independent experiments with biological and technical replicates are shown. Scale bars: 10 μm, n = 6. (c) After exposure to HG, HsRPE and ARPE-19 cells were subjected to western blot analysis. Cytosolic and lysosomal CTSB levels were independently analyzed with anti-CTSB, anti-ACTB, and anti-LAMP1. ACTB was used as a protein loading control in the cytosolic fraction, while LAMP1 was used as a protein loading control in the lysosomal fraction. The percentage of CTSB released from lysosomes into the cytosol was analyzed; representative images from three independent experiments with biological and technical replicates are shown, n = 6. (d) LTR staining and mean fluorescence intensity in HsRPE and ARPE-19 cells after exposure to HG for 0, 12, 24, or 48 h, as assessed by fluorescence microscopy. Representative images from three independent experiments with biological and technical replicates are shown. Scale bars: 20 μm, n = 6. (e) Proteolytic activity of CTSB and CTSL in HsRPE and ARPE-19 cells after exposure to NG or HG for 24 h, n = 6. (F) CTSB and CTSL activity in the retinas of non-diabetic and diabetic rats (all the non-diabetic and STZ-induced diabetic rats were fed with a regular diet). The bars represent the cathepsin activity expressed as RFU corrected for protein amount (μg), n = 10. (g) HsRPE and ARPE-19 cells were pretreated with complete medium containing geldanamycin (GA, 1 mM) or vehicle for 1 h and then exposed to HG for 24 h; the levels of SQSTM1 were analyzed by western blot. Representative images from three independent experiments with biological and technical replicates are shown, n = 6. #P > 0.05; **P < 0.01; *** P < 0.001.
