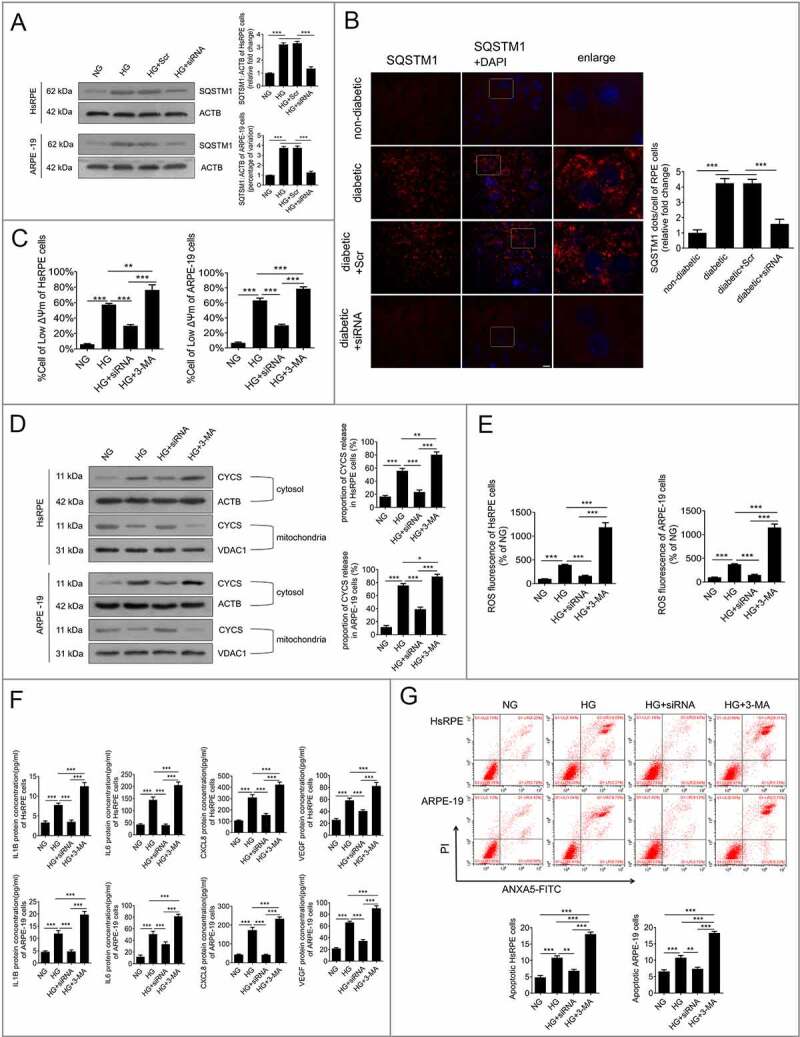
Figure 6.

Downregulation of HMGB1 expression restored the degradative capacity of autophagy. (a) HsRPE and ARPE-19 cells were transfected with siRNA-HMGB1 and Scr-siRNA and then exposed to HG for 24 h. Cell samples were processed and analyzed by immunofluorescence staining with anti-SQSTM1 and anti-ACTB antibodies. ACTB was used as a protein loading control. Representative images from three independent experiments with biological and technical replicates are shown, n = 6. (b) The RPE cells of non-diabetic, STZ-induced diabetic, STZ-induced diabetic+siRNA-Hmgb1 injected (diabetic+siRNA), and STZ-induced diabetic+Scr-siRNA injected (diabetic+Scr) rats (all rats were fed with a regular diet) were flat-mounted and stained for SQSTM1. The pictures were taken on the upper retina 100 μm away from the optic nerve. Representative images from three independent experiments with biological and technical replicates are shown. Scale bars: 10 μm, n = 10. (c) HsRPE and ARPE-19 cells were transfected with siRNA-HMGB1 or pretreated with 3-MA (5 mM) for 1 h and then coincubated with HG for 24 h. The Δψm values were analyzed by fluorometry, n = 6. (d) HsRPE and ARPE-19 cells were processed as described in (C). Cytosolic and mitochondrial CYCS levels were independently analyzed by western blot with anti-CYCS, anti-ACTB, and anti-VDAC1. ACTB was used as a protein loading control in the cytosol, while VDAC1 was used as a protein loading control in the mitochondria. The percentage of CYCS released from the mitochondria into the cytosol was analyzed. Representative images from three independent experiments with biological and technical replicates are shown, n = 6. (e) HsRPE and ARPE-19 cells were processed as described in (b). The intracellular ROS levels were analyzed using DCFH-DA with fluorometry, n = 6. (f) HsRPE and ARPE-19 cells were processed as described in (b). The expression of IL1B, IL6, CXCL8, and VEGF levels of serum was analyzed by ELISA, n = 6. (g) HsRPE and ARPE-19 cells were processed as described in (b). The proportion of apoptotic cells was analyzed using ANXA5-FITC-PI by flow cytometry, n = 6. *P < 0.05; ** P < 0.01; *** P < 0.001.
