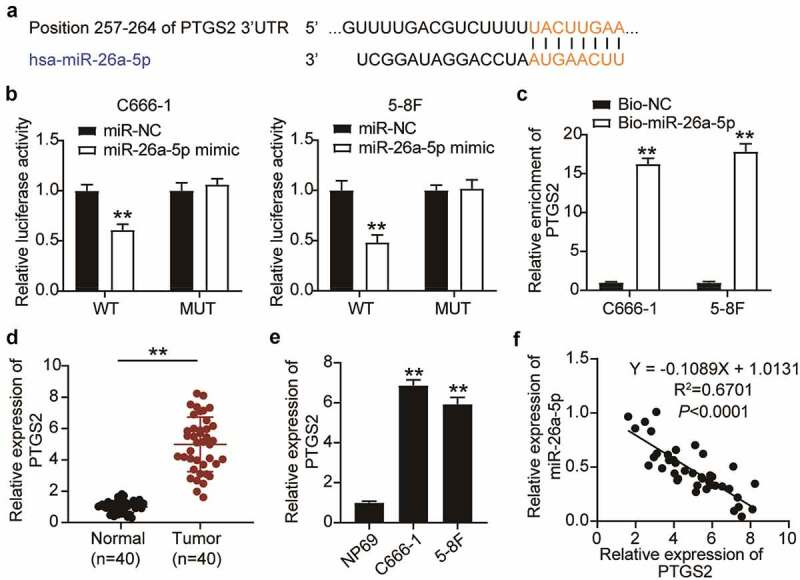
Figure 4.

PTGS2 was targeted by miR-26a-5p in NPC Cells. (a) The binding site between miR-26a-5p and PTGS2 was presented from targetscan. (b) Luciferase reporter assay demonstrated that miR-26a-5p mimic significantly inhibited the luciferase activity of vectors that carried the wild-type of 3’-UTR of PTGS2 in C666-1 and 5–8 F cells. The error bars indicate SD. n = 3. **P < 0.001 suggested a statistically significant difference in comparison with miR-NC co-transfected with PTGS2-WT. (c) RNA pull-down assay showed that PTGS2 enrichment level increased in C666-1 and 5–8 F cells treated with biotin labeled miR-26a-5p. The error bars indicate SD. n = 3. **P < 0.001 suggested a statistically significant difference in comparison with Bio-NC group. (d) qRT-PCR analysis was employed to measure PTGS2 mRNA expression in NPC tissues and normal tissues. **P < 0.001. (e) qRT-PCR analysis was employed to test PTGS2 mRNA expression in NPC cell lines and NP69 cell line. The error bars indicate SD. n = 3. **P < 0.001 suggested a statistically significant difference in comparison with NP69. (f) The correlation between miR-26a-5p and PTGS2 was conducted by Pearson correlation analysis. The error bars indicate SD.
