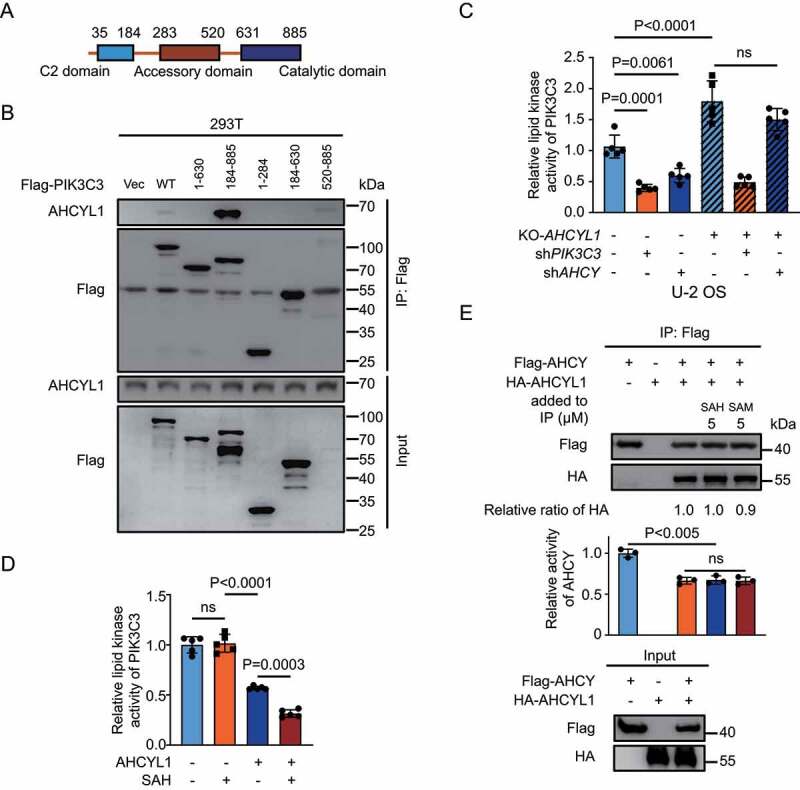
Figure 4.

SAH inhibits PIK3C3 through AHCYL1. (A) A schematic map of PIK3C3 structure. (B) The catalytic domain of PIK3C3 binds AHCYL1. The different truncated constructs of Flag-PIK3C3 were expressed in 293 T cells, followed by Co-IP for western blot analysis as indicated. (C) SAH inhibits lipid kinase activity of PIK3C3 through AHCYL1. The PtdIns3P levels were quantified by FYVE puncta in U-2 OS. KO-AHCYL1 increased PtdIns3P levels and KD-PIK3C3 abolished the increase by KO-AHCYL1. KD-AHCY decreased PtdIns3P levels and KO-AHCYL1 abolished the decrease by KD-AHCY. (D) SAH enhances PIK3C3 inhibition by AHCYL1 by in vitro lipid kinase assay. Flag-PIK3C3 and Flag-AHCYL1 were individually expressed into 293 T cells, followed by Flag IP and elution, the purified Flag-PIK3C3 was mixed with Flag-AHCYL1 and SAH as indicated. The lipid kinase activity of PIK3C3 was measured by ADP-Glo™ Kinase Assay kit. The denatured proteins were used as control. (E) SAH has no effect on the interaction between AHCYL1 and AHCY. Flag-AHCY and HA-AHCYL1 were expressed into 293 T cells. SAH and SAM were added into cell lysate for Flag IP. The activity of IPed AHCY was measured by HPLC. Bars and error bars represent mean values and SDs, respectively. The Two-way ANOVA was used for C, D, and E. ns represents no significance, defined as P > 0.05. N = 5 in C and D. N = 3 in E.
