FIG 8.
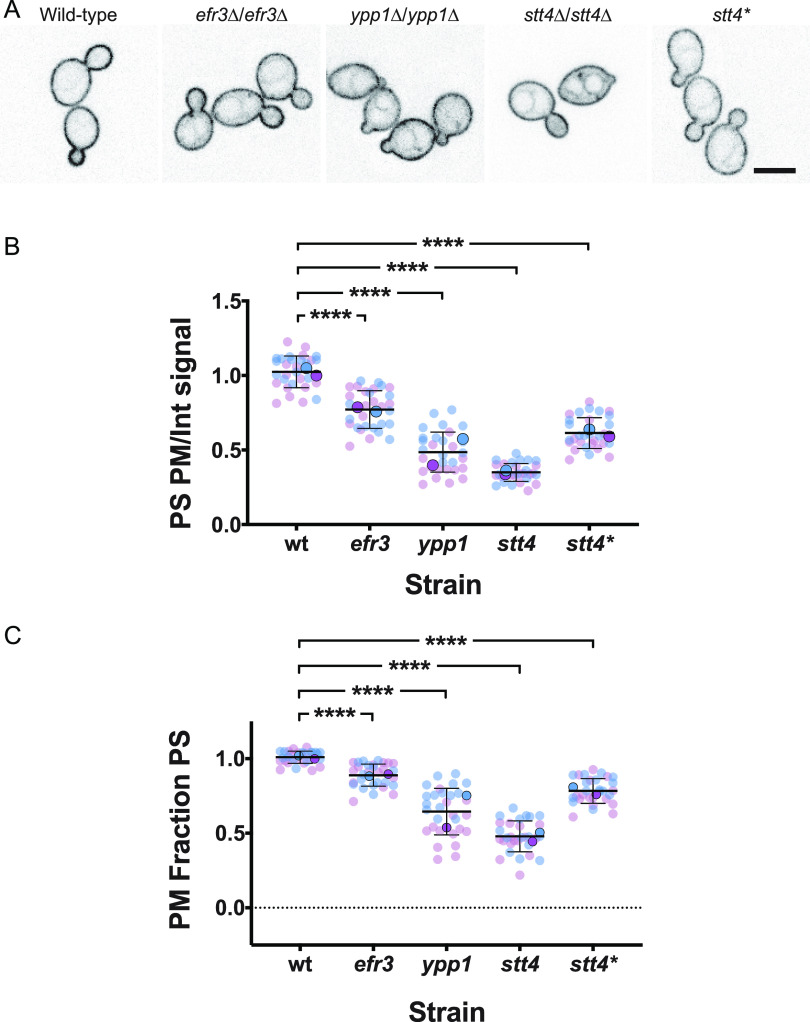
A reduction in plasma membrane PI(4)P results in an increase in PS at the ER. (A) Strains expressing PS reporter GFP-LactC2 (wild type, PY3239; efr3Δ/Δ, PY4124; ypp1Δ/Δ, PY4131; stt4Δ/Δ, PY5174; stt4Δ/Δ+stt4*, PY5903) were imaged, and central z-sections of representative cells are shown with an inverted LUT. Bar, 5 μm. (B and C) Quantitation of plasma membrane and internal signals reveals a progressive decrease in plasma membrane PS in efr3, ypp1, and stt4 strains. The ratio of plasma membrane to internal signal and the relative plasma membrane signal were determined as for Fig. 5B and C. For the wild type, the mean ratio of plasma membrane to internal signal was 4.5 and the ratio of plasma membrane to total signal was 0.8. Smaller symbols are values from two experiments (15 cells each); larger symbols are means from each experiment, with bars indicating overall means and standard deviations. ****, P < 0.0001.

