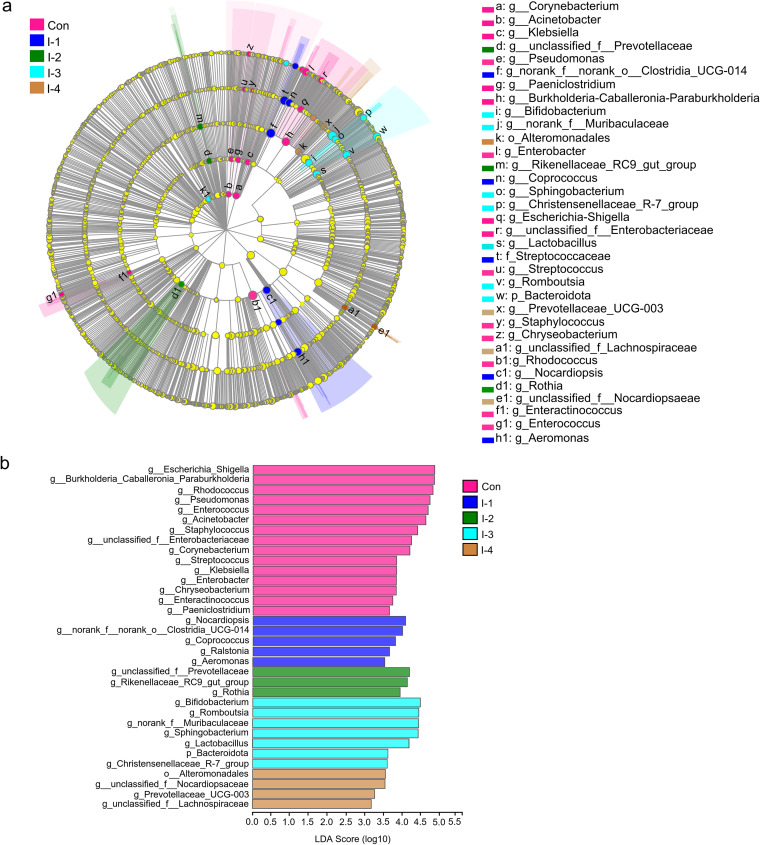
FIG 3.
The linear discriminant analysis effect size (LEfSe) analysis of milk microbial taxa among the control and different inulin groups. (A) The cladogram shows the taxa with significant differences in abundance (from phylum to genus level). (B) The LDA bar chart shows the influence of different bacteria on the differences among groups. The LDA score is >3.0. Con, control group; I-1, inulin-1 group (the inulin addition level was 100 g/day per cow); I-2, inulin-2 group (the inulin addition level was 200 g/day per cow); I-3, inulin-1 group (the inulin addition level was 300 g/day per cow); I-4, inulin-1 group (the inulin addition level was 400 g/day per cow).

