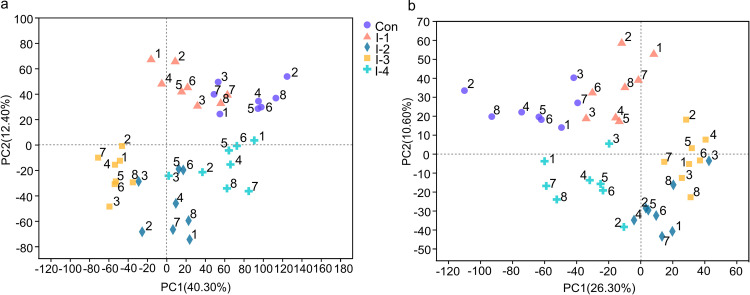
FIG 4.
(A and B) Principal-component analysis (PCA) plots of the milk metabolome of the control and different inulin groups in (A) positive and (B) negative ion modes. Con, control group; I-1, inulin-1 group (the inulin addition level was 100 g/day per cow); I-2, inulin-2 group (the inulin addition level was 200 g/day per cow); I-3, inulin-1 group (the inulin addition level was 300 g/day per cow); I-4, inulin-1 group (the inulin addition level was 400 g/days per cow).

