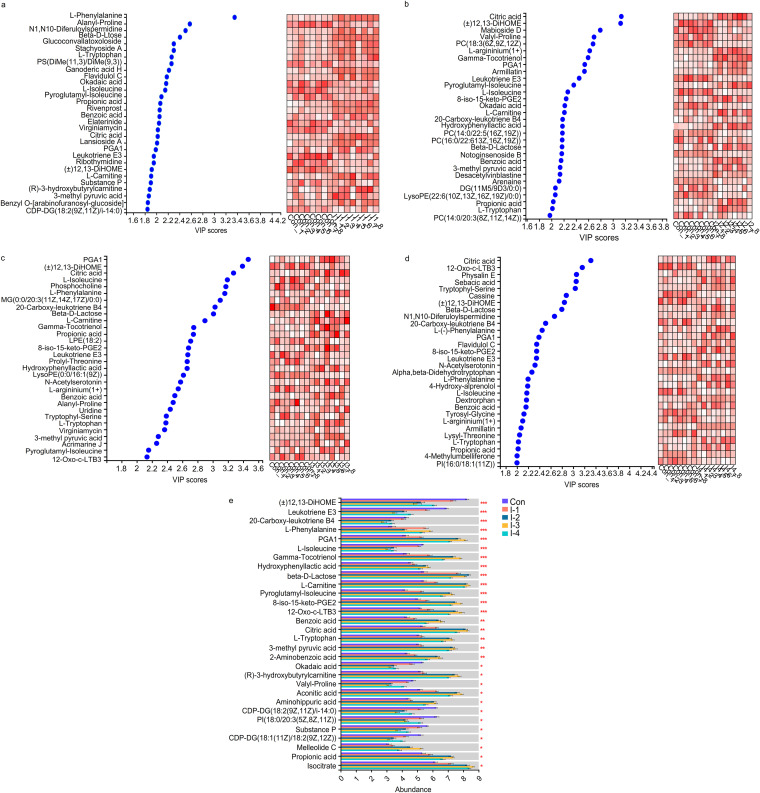
FIG 5.
Significance test of differences in milk metabolites based on pairwise comparison and multigroup tests. (A to D) Variable importance in projection (VIP) plots showing the significant differential metabolites (top 30 VIP scores) in milk samples between the control and I-1 groups, the control and I-2 groups, the control and I-3 groups, and the control and I-4 groups, respectively. Cells on the right are colored based on the relative abundance of metabolites in milk; red represents a high level, while white represents a low level. (E) Multigroup comparison bar chart showing the significantly differing metabolites (top 30 FDR-adjusted P values) in milk samples among the 5 groups. Con, control group; I-1, inulin-1 group (the inulin addition level was 100 g/day per cow); I-2, inulin-2 group (the inulin addition level was 200 g/day per cow); I-3, inulin-1 group (the inulin addition level was 300 g/day per cow); I-4, inulin-1 group (the inulin addition level was 400 g/day per cow). *, 0.01 < FDR-adjusted P value ≤ 0.05; **, 0.001 < FDR-adjusted P value ≤ 0.01; ***, FDR-adjusted P value ≤ 0.001.

