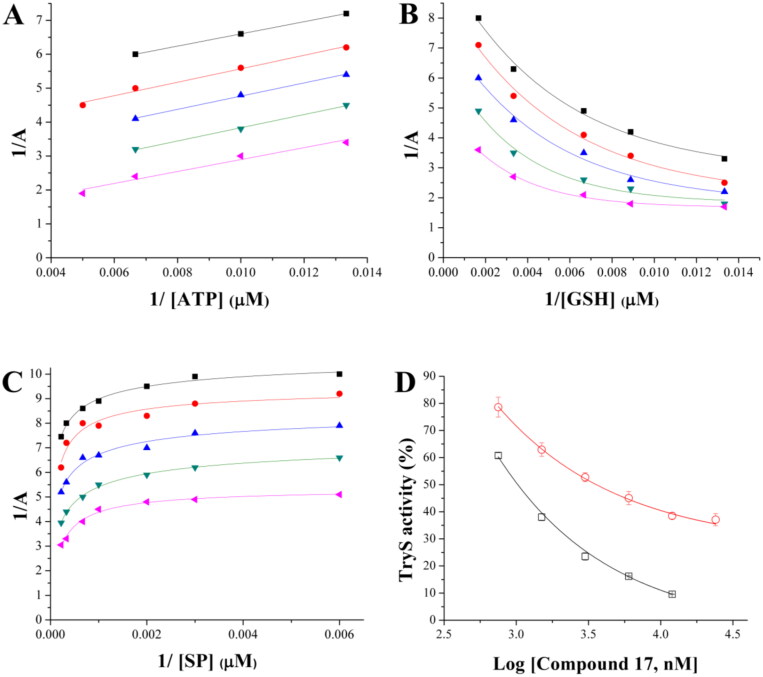
Figure 9.
Inhibition mechanism of 17 towards TbTryS. Lineweaver–Burk plots are shown for the varying substrate: (A) ATP, (B) glutathione (GSH) and (C) spermidine (SP). The kinetic analysis was performed at different inhibitors (black square: 12 µM, red circle: 6 µM, blue triangle: 3 µM, green inverted triangle: 1.5 µM, and pink triangle: 0.75 µM) and single substrate concentrations while maintaining fixed the concentration of the co-substrates (4.5 mM for SP, 200 µM for ATP and 150 µM for GSH). Enzyme velocity was measured using an end-point assay (see the section 1.3 Materials and methods for details). (D) TbTryS activity determined at different inhibitor concentrations and saturating concentrations of all substrates (SP: black empty square and Gsp: red empty circle).

