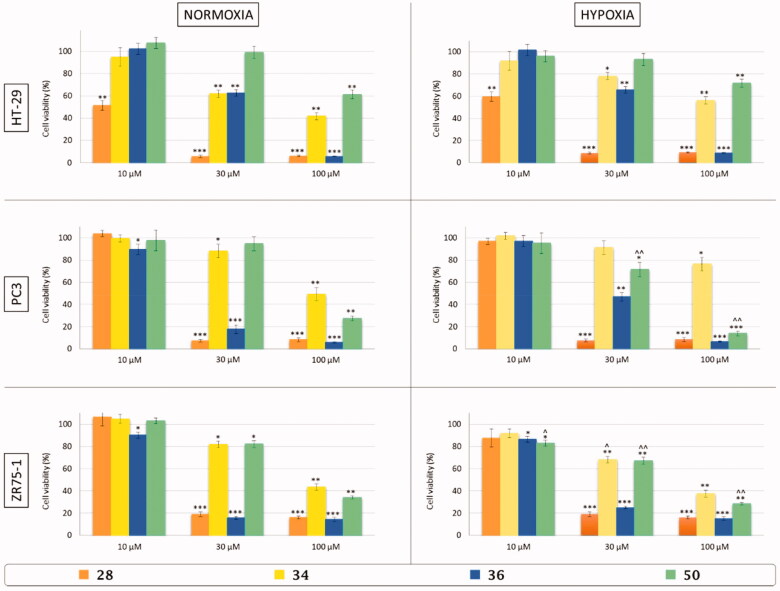
Figure 6.
In vitro cell viability assay of colon adenocarcinoma (HT-29), prostate adenocarcinoma (PC3), and breast cancer (ZR75-1) cell lines after 48 h of treatment with three different concentrations (10, 30, and 100 µM) of three-tailed inhibitors 28 (orange), 34 (yellow), 36 (blue), and 50 (green) in normoxic (21% O2) and hypoxic (3% O2) conditions. Control cells are arbitrarly set at 100% and results are expressed as the mean ± SEM of three experiments. One-way ANOVA was performed followed by a Bonferroni’s significant difference procedure. *p < .05, **p < .01, and ***p < .001 vs. control; ∧p < .05 and ∧∧p < .01 vs. normoxia.

