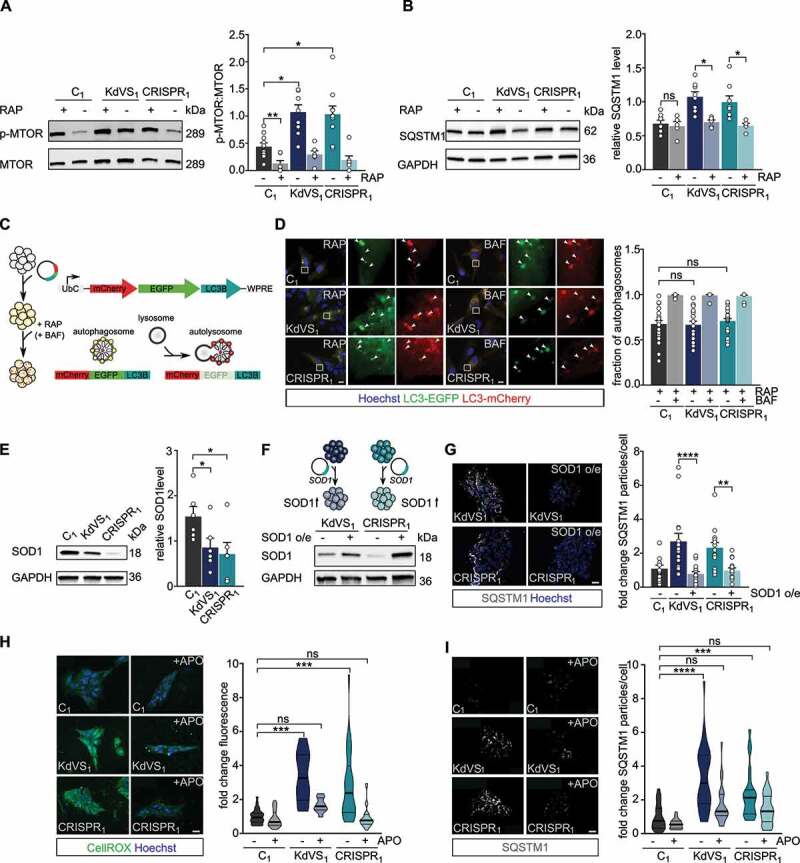
Figure 2.

Increased oxidative stress causes autophagosome accumulation. (A) Representative western blots for p-MTOR, and MTOR with and without rapamycin (RAP) treatment. RAP samples were incubated with 200 nM RAP for 10 min, followed by 2 h without RAP before cell lysis. Quantification of p-MTOR:MTOR ratio. n = 10 for C1; n = 7 for C1+ RAP; n = 9 for KdVS1; n = 6 for KdVS1 + RAP; n = 10 for CRISPR1; n = 7 for CRISPR1+ RAP. Protein levels were normalized to loading control. Treatment efficiency was assessed by means of unpaired t test between untreated and RAP treated samples of C1. (B) Representative western blots for SQSTM1 with and without RAP treatment. Quantification of SQSTM1. n = 8 for C1; KdVS1; CRISPR1; n = 5 for C1+ RAP; KdVS1+ RAP; CRISPR1+ RAP. Presented protein levels are relative to GAPDH. (C) Schematic representation of flux measurements through double-tagged mCherry-EGFP-LC3 transfection in iPSCs. (D) Example images of fluorescent LC3 detection after RAP and bafilomycin A1 (BAF; 200 nM for 10 min prior to RAP) treatment. Quantification of autophagosomes. n = 23 for C1+ RAP; n = 14 for C1+ RAP+BAF; n = 18 for KdVS1+ RAP; n = 14 for KdVS1+ RAP+BAF; n = 22 for CRISPR1+ RAP; n = 12 for CRISPR1+ RAP+BAF. (E) Representative western blots for SOD1 and SOD1 protein quantification. Protein levels were normalized to GAPDH. n = 6 for C1; KdVS1; CRISPR1. Statistical significance was tested by means of ordinary one-way ANOVA and Sidak’s multiple comparison test. (F) Schematic presentation and example western blots of SOD1 overexpression in KdVS1 and CRISPR1 iPSCs. (G) Representative images and quantification of SQSTM1 particles in iPSCs with and without SOD1 overexpression. n = 14 for C1; n = 15 for KdVS1; n = 15 for CRISPR1. (H) Representative images of iPSC colonies stained with CellROX and fluorescence quantification. iPSCs were either untreated or treated overnight with 100 µM apocynin (APO). n = 26 for C1; n = 23 for C1+ APO; n = 12 for KdVS1; n = 10 for KdVS1+ APO; n = 26 for CRISPR1; n = 28 for CRISPR1+ APO. Fluorescence levels were normalized to the untreated control. Scale bar: 20 µm. (I) Representative images of iPSC colonies stained for SQSTM1 and particle analysis. iPSCs were either untreated or treated overnight with 100 µM APO. n = 27 for C1; n = 24 for C1+ APO; n = 33 for KdVS1; n = 22 for KdVS1+ APO; n = 23 for CRISPR1; n = 23 for CRISPR1+ APO. Fluorescence levels were normalized to untreated control. Scale bar: 20 µm. Data presented in this figure were collected in at least 3 independent experiments. Statistically significant differences were determined by means of Kruskal Wallis and Dunn’s multiple comparison test, if not mentioned differently. *P < 0.05, **P < 0.01, ***P < 0.005, ****P < 0.0001.
