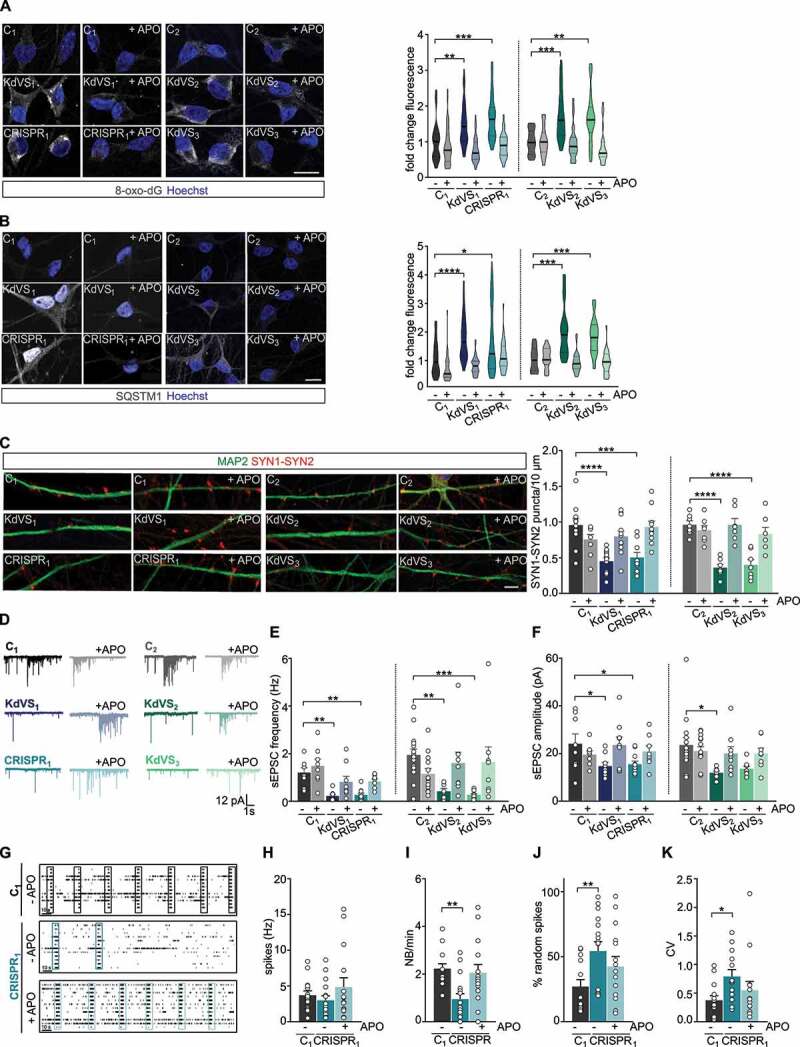
Figure 5.

Apocynin treatment rescues synaptic phenotype. (A) Representative images of 8-oxo-dG stainings and 8-oxo-dG quantification for untreated and APO treated iNeurons relative to respective untreated control cells at DIV21. n = 39 for C1; n = 46 for C1 + APO; n = 42 for KdVS1; n = 51 for KdVS1 + APO; n = 26 for CRISPR1; n = 25 for CRISPR1 + APO; n = 26 for C2; n = 25 for C2+ APO; n = 28 for KdVS2; n = 27 for KdVS2+ APO; n = 31 for KdVS3; n = 23 for KdVS3+ APO. Scale bar: 20 µm. (B) Representative images of SQSTM1 stainings of iNeurons at DIV21 and fluorescence quantification in untreated and APO treated iNeurons relative to untreated control cells at DIV21. n = 43 for C1; n = 34 for C1+ APO; n = 34 for KdVS1; n = 38 for KdVS1+ APO; n = 40 for CRISPR1; n = 39 for CRISPR1+ APO; n = 16 for C2; n = 19 for C2+ APO; n = 25 for KdVS2; n = 27 for KdVS2+ APO; n = 34 for KdVS3; n = 24 for KdVS3+ APO. Scale bar: 20 µm. (C) Representative images of dendrites stained for MAP2 and SYN1-SYN2 for C1, KdVS1 and CRISPR1 at DIV21 either untreated or APO treated and SYN1-SYN2 quantification. n = 11 for C1; n = 9 for C1+ APO; n = 12 for KdVS1; KdVS1+ APO; n = 10 for CRISPR1; CRISPR1+ APO; n = 7 for C2; C2+ APO; KdVS2; KdVS2+ APO; KdVS3, KdVS3+ APO. Scale bar: 20 µm. Two-way ANOVA was used to determine statistically significant changes. (D) Representative voltage clamp recordings at Vh = −60 mV showing sEPSCs at DIV21 with and without APO treatment during differentiation. (E) sEPSC frequency and (F) amplitude quantifications. n = 8 for C1; C1+ APO; n = 9 for KdVS1; KdVS1+ APO; n = 11 for CRISPR1; n = 8 for CRISPR1+ APO; n = 15 for C2; n = 14 for C2+ APO; n = 8 for KdVS2; n = 9 for KdVS2+ APO; n = 8 for KdVS3; KdVS3+ APO. (G) Representative raster plots for untreated C1 network and untreated and APO treated CRISPR1 network at DIV30 (3 min. of recording). Quantification of (H) mean firing rate, (I) network burst frequency, (J) percentage of random spikes, and (K) CV of inter-network burst interval. n = 15 for C1; n = 17 for C1 + APO; n = 16 for CRISPR1; n = 15 for CRISPR1 + APO. All data presented in this figure were generated in at least 2 independent experiments and statistically significant differences were tested through Kruskal-Wallis and Dunn’s multiple comparison test, if not mentioned differently. All samples were always compared to the respective untreated control; only significant differences were indicated. *P < 0.05, **P < 0.01, ***P < 0.005, ****P < 0.0001.
