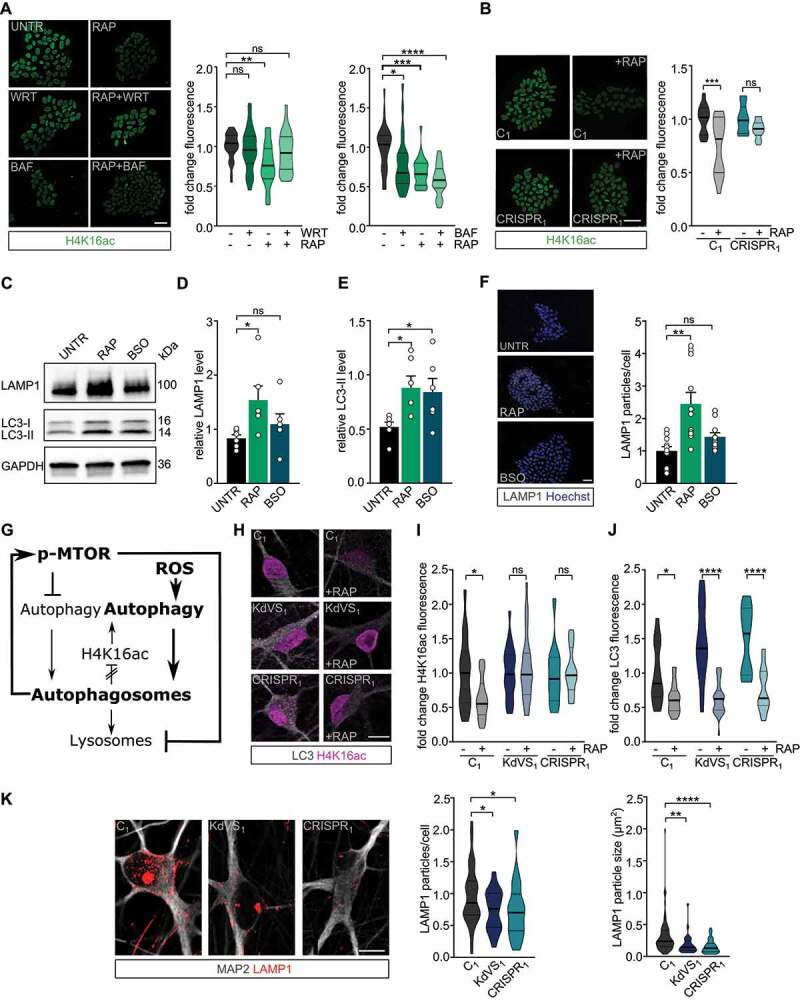
Figure 6.

Feedback loop activation and reduced lysosomal activity. (A) Representative images of iPSCs treated with RAP and/or wortmannin (WRT) or bafilomycin A1 (BAF) stained for H4K16ac. Fluorescence was always normalized to untreated control samples. n = 29 for RAP/WRT treatments; n = 25 for RAP/BAF treatments. Two-way ANOVA and Tukey’s multiple comparison test were used to test for statistically significant differences. Scale bar: 50 µm. (B) Representative images of iPSC colonies of C1 and CRISPR1 untreated or treated with RAP for 10 min. 2 h after the treatment cells were fixed and stained for H4K16ac. n = 12 for C1; n = 15 for C1 + RAP; n = 10 for CRISPR1; n = 14 for CRISPR1 + RAP. Two-way ANOVA and Sidak’s multiple comparison test were used to determine statistically significant reductions. Scale bar: 50 µm. (C) Representative western blot for LAMP1 and LC3 after autophagy induction for 10 min by either RAP or BSO in control iPSCs. (D) LAMP1 protein level quantification and (E) LC3-II quantification relative to GAPDH. n = 6 for all conditions. Ordinary one-way ANOVA and Holm-Sidak’s multiple comparison test were used to test for statistically significant differences. (F) Representative images of LAMP1 stainings in control iPSCs treated with RAP or BSO for 10 min before fixation and particle analysis for LAMP1. n = 11 for all conditions. Scale bar: 50 µm. One-way ANOVA and Dunnett’s multiple comparison test were used to determine statistically significant differences. (G) Schematic representation of autophagy regulation showing the two different autophagy inducing pathways discussed (MTOR and ROS). NSL complex mediated feedback-loop is induced by autophagosome formation. At the same time MTOR phosphorylation is increased, which subsequently reduces lysosomal activity. (H) Representative images of iNeurons either untreated or RAP treated, stained for LC3 and H4K16ac. (I) H4K16ac fluorescence quantification. n = 16 for C1; n = 21 for C1+ RAP; n = 16 for KdVS1; n = 26 for KdVS1+ RAP; n = 12 for CRISPR1; n = 19 for CRISPR1+ RAP. (J) LC3 quantification. n = 13 for C1; n = 22 for C1+ RAP; n = 20 for KdVS1; n = 29 for KdVS1+ RAP; n = 12 for CRISPR1; n = 19 for CRISPR1+ RAP. Statistically significant changes were determined by means of two-way ANOVA and Sidak´s multiple comparison. (K) Representative images of three-week old neurons from C1, KdVS1 and CRISPR1 stained for MAP2 and LAMP1 and LAMP1 particle quantification. n = 43 for C1; n = 29 for KdVS1; n = 36 for CRISPR1. Results were normalized to control. Scale bar: 10 µm. One-way ANOVA and Dunnett’s multiple comparison test were used to determine significant differences for the number of particles. Differences in particle size were tested through Kruskal Wallis and Dunn’s multiple comparison test. Data presented in this figure were obtained in at least 2 independent experiments. *P < 0.05, **P < 0.01, ***P < 0.005, ****P < 0.0001.
