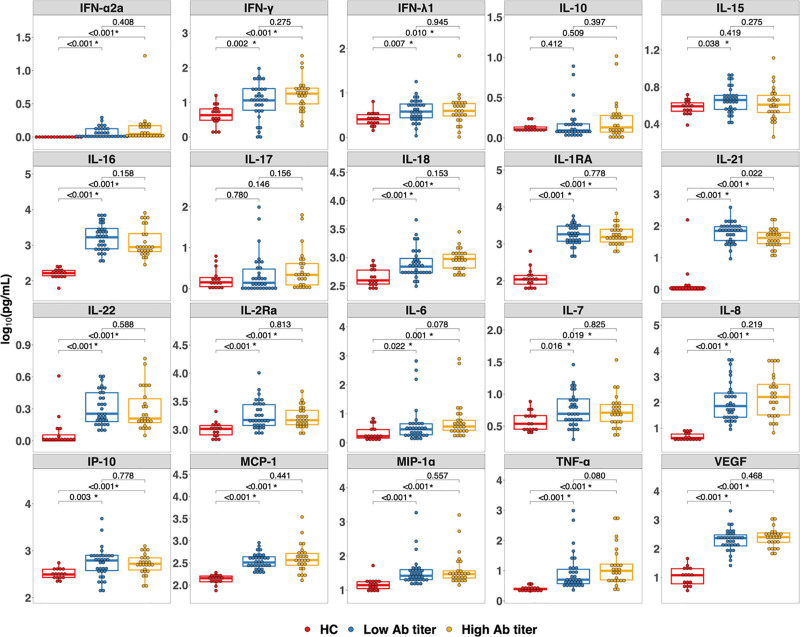
FIGURE 1.
Cytokines in SOTRs and healthy controls before first dose of a 2-dose mRNA-based vaccine series. Each cytokine or chemokine measured is indicated in the gray header above each panel. Differences among the healthy controls (red, n = 16), SOTRs who developed low-titer responses (blue, n = 32), and SOTRs who developed high-titer responses (yellow, n = 26) after vaccination were determined by a 2-tailed Wilcoxon-Rank-Sum test. Multiple comparisons were controlled using the Benjamini-Hochberg procedure with false discovery rate of 0.05. Significant P after adjusting for multiple comparisons are marked with *. The boxplots represent the interquartile range. The median is represented by a horizontal line in the box. The lower and upper whiskers represent 1.5× the interquartile range beyond the quartiles. Each dot represents an individual sample. Low-titer (ratio < 3.5) and high-titer (ratio ≥ 3.5) were based on the classification of low-titer vs high-titer convalescent plasma set by the FDA.20 Ab, antibody; HC, healthy control; IFN, interferon; IL, interleukin; IP-10, Interferon-γ-inducible protein 10; MCP, monocyte chemoattractant protein; MIP, macrophage inflammatory protein; SOTR, solid organ transplant recipient; TNF, tumor necrosis factor; VEGF, vascular endothelial growth factor.

